
Finding an investment property for sale requires an analytical mind if you hope to achieve your dream of becoming a real estate investor.
When you’re trying to find a good investment property for sale in 2023, you can’t do so without paying close attention to market stats and analytics. However, while accessing such information has become easier, knowing what to look for in a market’s stats is key to success.
Table of Contents
- Is Buying a Rental Property a Good Investment in 2023?
- 4 Steps to Finding a Good Investment Property for Sale
- 20 Cities With Profitable Investment Properties for Sale
Making a profit in real estate isn’t only about finding cheap residential or rental investment property for sale. There are other details that every real estate investor should take into consideration when searching for investment property.
In this article, we will find out if buying a property is a good investment in 2023 and what to look for when trying to find investment property for sale.
Additionally, we will give you a list of some of the best cities for investing in profitable rental properties for sale in the US.
Is Buying a Rental Property a Good Investment in 2023?
As the year is coming to an end, beginner investors are wondering if buying an investment property is a good idea in 2023.
When you look at the state of the US housing market, the first instinct that most people have is that it’s not a good time to buy a residential property. It is due to a number of factors that include:
- Property prices have gone up significantly over the last couple of years.
- Millennials can no longer afford to buy properties and would rather rent instead.
- The price to rent ratio is high across the US, which means renting is more affordable in general.
All of the above factors indicate that buying residential real estate is not a good idea in 2023.
However, when it comes to buying investment property for the sake of making a profit, the abovementioned factors present a lucrative opportunity.
What Is the Meaning of Investment Property?
When it comes to buying real estate, it is important to differentiate between finding a primary residential home and finding investment property for sale.
Real estate investors who want to own rental real estate as their investment strategy will significantly benefit from the current state of the market. Due to non-investors becoming less inclined to purchase property, the demand for rental real estate has gone up significantly. Along with the increased came a rise in rental rates across the US.
What it means is that if you own rental investment property, then it’s going to be easier for you to generate rental income and make a profit.
It is why in today’s market, there is a high demand for the development of multi unit rentals because they are becoming very lucrative investment properties.
You should remember that if you plan on buying an investment property with the goal of reselling it for a profit, it will be harder than renting it out. It is because most of the buying power in the current market is made up of real estate investors instead of primary home buyers. Reselling the investment property at a profitable rate will be difficult.
And while the median property price is still expected to go up slowly in 2023, if you don’t manage to resell the property in the near future, you risk prices going down again.
So, when trying to find investment property for sale in 2023, it’s important to focus on the stats that matter based on the rental strategy you want to use.
Rental Strategy: Long Term vs Short Term
When looking at real estate market stats, the ones that matter to you will depend on the rental strategy that you want to use.
A long term rental strategy is the most common and popular type of investment property among investors. Long term rentals are properties that you rent out for long periods of time, typically longer than a year.
Such type of rental properties is also the safest and most reliable real estate investment because there is always a demand for rental properties.
A short term rental strategy, on the other hand, is relatively new. Short term rentals are investment properties that you rent out for short periods of time, typically less than a week.
One unique aspect about short term rentals is that you can rent out a room in your primary residence to make an extra profit from a property that you already own.
You can rent out your property as a short term rental using online platforms like Airbnb. Most of your guests will consist of tourists, vacationists, and business travelers.
Since each property attracts a very different type of demand, the stats that you need to pay attention to for each investment strategy are very different.
Related: The Definitive Guide to the Rental Property Investment Strategy
Example: Preferred Rental Strategy in Illinois
To showcase how the stats can be different for each strategy, let’s take a look at the real estate market of Illinois and compare it to the average US market.
When looking at Illinois investment property for sale for the purpose of turning it into a long term rental, you will want to look at the number of long term rental listings there.
In Illinois, there are around 16,690 long term rentals for sale compared to the average of 7,287 units in the US. Additionally, the average cap rate of a long term rental in Illinois is 0.29% higher than the US average.
Considering that other relevant market stats, such as the median property price and the average cash on cash return, are also above average, we can assume that long term rentals are lucrative in the state.
However, when looking at the same stats for short term rentals, we’ll find that the number of short term listings for sale in Illinois is significantly lower than in other states. And if we look at the monthly rental income or the occupancy rates of short term rentals, we’ll find that the stats are below average.
It doesn’t necessarily mean that it’s not a good idea to invest in short term rentals in Illinois. But it does mean that the market is generally favorable towards this type of investment.
Of course, when digging deeper into smaller markets within Illinois, such as different cities or even neighborhoods, the stats can change significantly.
So, if you’ve set your mind on finding an Illinois investment property for sale, you can use Mashvisor to analyze the market and find the perfect location.
4 Steps to Finding a Good Investment Property for Sale
So, you might be wondering, at this point, how exactly do you go about finding a good investment property for sale? Of course, the answer depends entirely on the strategy that you want to use.
Since owning rental real estate is considered to be the safest and best investment strategy going into 2023, we will focus on finding rental investment properties for sale.
The steps to finding a good investment property for sale with the purpose of renting it out will also depend on the rental strategy, as we saw in the previous section.
However, if you follow the steps below, the process of analyzing markets and finding cheap or affordable residential or even multi unit rentals will become much easier.
Step 1: Obtaining Real Estate Market Data
The first step to finding a good investment property for sale is to get access to reliable data that you can analyze. There are many ways in which you can acquire data.
Many beginner investors choose to hire a real estate agent right from the start. It is because a licensed agent can access the MLS, where most of the real estate data can be found.
However, there are many alternatives nowadays that are more suitable and cheaper for beginner investors to use and to learn from. Mashvisor, for example, offers access to a very wide range of real estate data that covers most markets in the US.
But what kind of data will you need, exactly?
Generally, all reliable data and information that you can gather about a market will help you in your search.
For example, if you’re investing in the Florida real estate market, you will need to at least find out the following:
- What is the median property price in Florida?
- What’s the average rental rate for long term and short term rentals in Florida?
- What’s the average occupancy rate of short term rentals?
- What types of properties generate the highest returns on average?
If what you’re getting access to is raw market data, you’ll need to create spreadsheets and sort through the data before you are able to come up with useful conclusion about the market. However, online tools like Mashvisor can provide you with data in the form of analytics and insights.
For example, in addition to providing you with the raw data in the form of Excel sheets, Mashvisor’s platform will also give you insights that directly answer the above questions.
Step 2: Calculate the Necessary Stats
What are the most important stats to look for when trying to find a good investment property for sale?
While the following isn’t a conclusive list, here are the most important stats to look for when analyzing rental properties:
- Median property price
- Number of listings for sale
- Long term and short term rental income
- Capitalization rate of short term and long term rentals
- Cash on cash return of rental properties
If you’re using Mashvisor to get your stats, you will get all of the above metrics included in the reports by default. However, if you’re getting your data from a real estate agent or other sources that don’t offer you analytics and insights, you’ll need to do some calculations on your own.
Since the cash on cash return and the cap rate are the two main metrics used for analyzing the rate of return on a rental property, we highly recommend that you learn more about them.
When it comes to calculating the two metrics, you will need to gather more information about the recurring costs and fees associated with owning an investment property. It is because you’ll need to account for all the money that you’re spending on the investment property before you can find out your rate of return.
Luckily, Mashvisor is able to provide both metrics (and more) because the platform includes the average costs and fees of buying and owning a rental property, such as:
- Property taxes
- Rental income taxes
- Insurance
- Property maintenance
- Property management
- Utilities
- Mortgage payments
- HOA fees
Of course, to get the most accurate results, it is recommended to do your own research to make sure that all the costs and fees are as close to accurate as possible.
Related: How to Lower Property Taxes: 10 Tips and Tricks
Step 3: Analyze and Compare Market Stats
So, now you have access to real estate market data, insights, and analytics. What is your next step?
In this step, you want to use the data that you have to narrow down your search further and further until you’ve reached the market level of a street or neighborhood that you can invest in.
I like to imagine it as peeling off an onion.
If you don’t have a specific state or market in mind and you’re looking for the best market to invest in anywhere in the US, then you can start at the largest level. Of course, it is always to have nationwide stats to use as a focal point.
When trying to decide on a state to invest in, you want to compare the stats of each state with the nationwide stats to see which ones are performing above or below average in certain areas.
This is very similar to the example we gave earlier about the Illinois housing market. By comparing Illinois with the larger US market, we saw that median property prices are below average, which means it is a cheap or affordable market.
We also saw that the stats for long term rental strategy are more favorable than short term rentals. By following the same logic, once you’ve found a state that you like in terms of its stats, you can look at smaller markets within that state.
So, you look at city-specific market stats and compare them with the state’s average to find cities that suit your investment criteria.
After that, you go into the neighborhood or street level, where you can start comparing individual properties or property types with one another.
Step 4: Finding a Good Rental Property for Sale Using Rental Comps
Once you’ve decided on a specific market, like a neighborhood that you want to invest in, it’s time to do rental comps.
Rental comps refer to the process of comparing rental properties that are similar to one another based on their stats. The process is very similar to what we’ve been doing up to this point, and the type of stats you will be comparing are almost the same.
But instead of looking at median prices and average rental rates, you will now be looking at actual prices and rental rates of rental properties for sale.
However, in order to get realistic and accurate results, rental comps limit your comparison to properties that are of a similar nature.
It means that if you want to buy a multi unit rental, then you should only compare it with other multi units with similar sizes, are located in the same area, and would appeal to the same type of tenants.
To decide on the type of investment property that is most appropriate for your rental strategy, you can compare the stats of specific property types to one another.
For example, you can compare the stats of condos vs townhouses in terms of their short term occupancy rate and daily rental rates to see which one is better for short term renting.
And by running rental comps on townhouses in that neighborhood, you should be able to identify specific properties that are performing or expected to perform better than the average townhouse in that area.
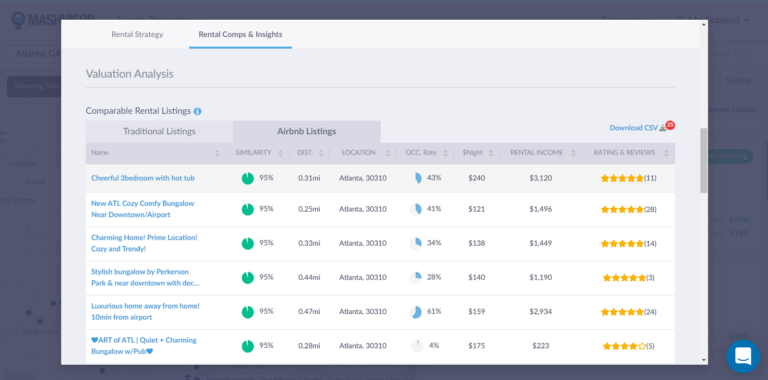
You can use rental comps to find a good investment property for sale by comparing rental properties that are similar to one another based on their stats.
20 Cities With Profitable Investment Properties for Sale
Now that you know what goes into the process of finding a good investment property for sale, let’s talk about the best cities for investing in rental properties in the US.
It’s important to keep in mind that the following list of top cities for investing in long term and short term rentals is based on Mashvisor’s data and criteria.
Since long term and short term rentals each have different markets where they’re performing especially well, we created two lists:
- Top 10 cities for investing in long term rentals
- Top 10 cities for investing in short term rentals
Additionally, in order to ensure that the markets are profitable based on their data, the following criteria were followed:
- Markets where the median property price is below $1 million
- With more than 100 long/short term rental listings for sale
- Average long/short term monthly rental income is above $2,000
- Markets where the average long/short term rental offers a cash on cash return of above 2%
- A price to rent ratio of 20 or higher (for long term rentals)
- An occupancy rate of 50% or above (for short term rentals)
As discussed before, the above are the most important stats to consider when analyzing markets to determine if it’s a good idea to find investment property for sale.
Based on our chosen criteria, the markets on the list will be affordable, show a healthy inventory, with high demand for rental properties, and offer a profitable rate of return.
Related: What Is the Ideal Rate of Return on a Rental Property?
Top 10 Markets for Investing in Long Term Rental Property
Listed below are our top picks for 10 markets to find a long term rental property for sale. The locations are arranged from the highest to the lowest cash on cash return, based on Mashvisor’s October 2022 location report.
1. Vero Beach, FL
- Median Property Price: $727,992
- Average Price per Square Foot: $294
- Days on Market: 91
- Number of Long Term Rental Listings: 628
- Monthly Long Term Rental Income: $2,618
- Long Term Rental Cash on Cash Return:26%
- Long Term Rental Cap Rate:37%
- Price to Rent Ratio: 23
- Walk Score: 78
2. Hallandale Beach, FL
- Median Property Price: $728,539
- Average Price per Square Foot: $415
- Days on Market: 92
- Number of Long Term Rental Listings: 642
- Monthly Long Term Rental Income: $2,853
- Long Term Rental Cash on Cash Return:61%
- Long Term Rental Cap Rate:72%
- Price to Rent Ratio: 21
- Walk Score: 79
3. Stuart, FL
- Median Property Price: $719,961
- Average Price per Square Foot: $361
- Days on Market: 68
- Number of Long Term Rental Listings: 376
- Monthly Long Term Rental Income: $2,931
- Long Term Rental Cash on Cash Return:57%
- Long Term Rental Cap Rate:62%
- Price to Rent Ratio: 20
- Walk Score: 42
4. Fountain Hills, AZ
- Median Property Price: $885,044
- Average Price per Square Foot: $359
- Days on Market: 92
- Number of Long Term Rental Listings: 122
- Monthly Long Term Rental Income: $3,161
- Long Term Rental Cash on Cash Return:42%
- Long Term Rental Cap Rate:46%
- Price to Rent Ratio: 23
- Walk Score: 39
5. Dania Beach, FL
- Median Property Price: $609,500
- Average Price per Square Foot: $376
- Days on Market: 63
- Number of Long Term Rental Listings: 238
- Monthly Long Term Rental Income: $2,404
- Long Term Rental Cash on Cash Return:37%
- Long Term Rental Cap Rate:45%
- Price to Rent Ratio: 21
- Walk Score: 86
6. North Miami, FL
- Median Property Price: $829,727
- Average Price per Square Foot: $392
- Days on Market: 31
- Number of Long Term Rental Listings: 248
- Monthly Long Term Rental Income: $3,224
- Long Term Rental Cash on Cash Return:31%
- Long Term Rental Cap Rate:40%
- Price to Rent Ratio: 21
- Walk Score: 52
7. Williamsburg, VA
- Median Property Price: $565,289
- Average Price per Square Foot: $223
- Days on Market: 62
- Number of Long Term Rental Listings: 181
- Monthly Long Term Rental Income: $2,139
- Long Term Rental Cash on Cash Return:23%
- Long Term Rental Cap Rate:31%
- Price to Rent Ratio: 22
- Walk Score: 81
8. Riviera Beach, FL
- Median Property Price: $810,151
- Average Price per Square Foot: $404
- Days on Market: 75
- Number of Long Term Rental Listings: 281
- Monthly Long Term Rental Income: $2,686
- Long Term Rental Cash on Cash Return:25%
- Long Term Rental Cap Rate:30%
- Price to Rent Ratio: 25
- Walk Score: 43
9. Melbourne, FL
- Median Property Price: $496,841
- Average Price per Square Foot: $257
- Days on Market: 64
- Number of Long Term Rental Listings: 581
- Monthly Long Term Rental Income: $2,054
- Long Term Rental Cash on Cash Return:18%
- Long Term Rental Cap Rate:26%
- Price to Rent Ratio: 20
- Walk Score: 73
10. Punta Gorda, FL
- Median Property Price: $655,944
- Average Price per Square Foot: $319
- Days on Market: 100
- Number of Long Term Rental Listings: 347
- Monthly Long Term Rental Income: $2,719
- Long Term Rental Cash on Cash Return:21%
- Long Term Rental Cap Rate:25%
- Price to Rent Ratio: 20
- Walk Score: 14
If you want to start searching for profitable investment property for sale right now, click here.
Top 10 Markets for Investing in Short Term Rental Property
And now, let’s take a look at the markets that are considered best for investing in short term rentals.
It is important to mention that short term rentals are typically subject to unique laws and regulations in each market. Make sure to do your search about the legality of Airbnb or short term rentals in your area or the market that you want to invest in.
Here are the 10 best markets for investing in short term rentals, ranked from the highest to the lowest cash on cash return using data from Mashvisor’s October 2022 location report:
1. Schiller Park, IL
- Median Property Price: $280,389
- Average Price per Square Foot: $208
- Days on Market: 54
- Number of Short Term Rental Listings: 110
- Monthly Short Term Rental Income: $3,853
- Short Term Rental Cash on Cash Return:85%
- Short Term Rental Cap Rate:10%
- Short Term Rental Daily Rate: $155
- Short Term Rental Occupancy Rate: 59%
- Walk Score: 71
2. Reading, OH
- Median Property Price: $225,180
- Average Price per Square Foot: $139
- Days on Market: 40
- Number of Short Term Rental Listings: 171
- Monthly Short Term Rental Income: $2,874
- Short Term Rental Cash on Cash Return:85%
- Short Term Rental Cap Rate:14%
- Short Term Rental Daily Rate: $117
- Short Term Rental Occupancy Rate: 53%
- Walk Score: 80
3. West Saint Paul, MN
- Median Property Price: $268,376
- Average Price per Square Foot: $169
- Days on Market: 35
- Number of Short Term Rental Listings: 320
- Monthly Short Term Rental Income: $3,367
- Short Term Rental Cash on Cash Return:70%
- Short Term Rental Cap Rate:86%
- Short Term Rental Daily Rate: $151
- Short Term Rental Occupancy Rate: 62%
- Walk Score: 75
4. Bellwood, IL
- Median Property Price: $257,900
- Average Price per Square Foot: $198
- Days on Market: 54
- Number of Short Term Rental Listings: 152
- Monthly Short Term Rental Income: $3,677
- Short Term Rental Cash on Cash Return:45%
- Short Term Rental Cap Rate:69%
- Short Term Rental Daily Rate: $161
- Short Term Rental Occupancy Rate: 64%
- Walk Score: 82
5. Richmond Heights, OH
- Median Property Price: $229,130
- Average Price per Square Foot: $131
- Days on Market: 108
- Number of Short Term Rental Listings: 234
- Monthly Short Term Rental Income: $2,958
- Short Term Rental Cash on Cash Return:45%
- Short Term Rental Cap Rate:63%
- Short Term Rental Daily Rate: $136
- Short Term Rental Occupancy Rate: 51%
- Walk Score: 23
6. Clawson, MI
- Median Property Price: $256,732
- Average Price per Square Foot: $219
- Days on Market: 30
- Number of Short Term Rental Listings: 298
- Monthly Short Term Rental Income: $3,185
- Short Term Rental Cash on Cash Return:18%
- Short Term Rental Cap Rate:42%
- Short Term Rental Daily Rate: $167
- Short Term Rental Occupancy Rate: 52%
- Walk Score: 69
7. Luray, VA
- Median Property Price: $416,415
- Average Price per Square Foot: $222
- Days on Market: 67
- Number of Short Term Rental Listings: 192
- Monthly Short Term Rental Income: $4,183
- Short Term Rental Cash on Cash Return:00%
- Short Term Rental Cap Rate:10%
- Short Term Rental Daily Rate: $239
- Short Term Rental Occupancy Rate: 54%
- Walk Score: 52
8. Neptune, NJ
- Median Property Price: $472,680
- Average Price per Square Foot: $310
- Days on Market: 55
- Number of Short Term Rental Listings: 425
- Monthly Short Term Rental Income: $5,301
- Short Term Rental Cash on Cash Return:99%
- Short Term Rental Cap Rate:09%
- Short Term Rental Daily Rate: $357
- Short Term Rental Occupancy Rate: 51%
- Walk Score: N/A
9. Robbinsdale, MN
- Median Property Price: $303,400
- Average Price per Square Foot: $159
- Days on Market: 36
- Number of Short Term Rental Listings: 335
- Monthly Short Term Rental Income: $3,387
- Short Term Rental Cash on Cash Return:94%
- Short Term Rental Cap Rate:13%
- Short Term Rental Daily Rate: $166
- Short Term Rental Occupancy Rate: 56%
- Walk Score: 73
10. West Allis, WI
- Median Property Price: $238,308
- Average Price per Square Foot: $156
- Days on Market: 23
- Number of Short Term Rental Listings: 112
- Monthly Short Term Rental Income: $2,437
- Short Term Rental Cash on Cash Return:86%
- Short Term Rental Cap Rate:05%
- Short Term Rental Daily Rate: $119
- Short Term Rental Occupancy Rate: 70%
- Walk Score: 54
To start looking for the most lucrative investment property for sale, click here.
Bottom Line: Finding a Good Investment Property for Sale
To me, making a good real estate investment is all about finding a good investment property for sale near me.
Whether you’re looking for a long term rental or a vacation rental that you can rent out on Airbnb, knowing how to find one that suits you requires data and analytics.
Knowing what stats to look for in the investment property that you want depends on the rental strategy that you want to use.
Long term residential rentals rely on different metrics to determine their viability than Airbnb or vacation rentals. Once you’re able to identify the stats that are most relevant to your investment strategy, you can use any of the available data sources to begin your research.
But the best place to start is with Mashvisor.
Mashvisor offers you investment property analytics and insights based on data that we get from the MLS and from Airbnb for both long term and short term rentals. The platform allows you to find good investment property for sale anywhere in the US based on up-to-date real estate data.
Whether you want to find a vacation rental for sale to rent out on Airbnb or you’re trying to compare the different markets to find the best one for you – Mashvisor can help.
Want to give Mashvisor a try? Start your 7-day free trial now.