
In the ever-evolving world of cryptocurrency trading, strategies that enable traders to identify potential reversals and trends hold paramount importance. One such tool that has gained significant popularity among traders is the Parabolic Stop and Reverse (SAR) indicator. In this comprehensive guide, we’ll delve into the intricacies of the Parabolic SAR indicator and its application. Trade smarter, not harder – start by visiting Tesler to experience the best trading platform around.

What is the Parabolic SAR Indicator?
The Parabolic SAR, created by J. Welles Wilder, serves as a valuable tool in technical analysis, aimed at detecting potential shifts in trends within price charts. Its application is particularly advantageous in markets marked by high volatility, such as the cryptocurrency market, where rapid alterations in trends can take traders by surprise.
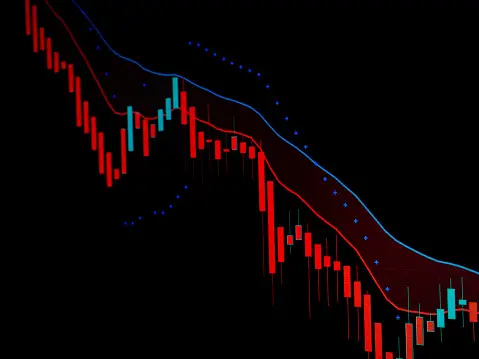
This indicator is visually represented as a sequence of dots positioned either above or below the price chart. These dots function as conceivable levels for setting stop-loss orders by traders. With each new price period, the position of these dots adjusts accordingly. When these dots are positioned below the price line, they indicate a bullish trend. Conversely, when they appear above the price line, they signify a bearish trend.
How Does Parabolic SAR Work?
The Parabolic SAR formula takes into account both price and time, making it sensitive to changes in both dimensions. When a trend is established, the SAR dots accelerate in their position, indicating an increasing trend strength. However, the dots eventually catch up with the price, and this intersection serves as a potential reversal point.
In the context of Bitcoin trading, if the SAR dots are below the price, it suggests an upward trend. Conversely, when the dots move above the price, it indicates a downward trend. When the dots switch positions, traders often consider it a signal for a potential trend reversal.
Applying Parabolic SAR to Bitcoin Trading
Bitcoin, being a highly volatile cryptocurrency, experiences rapid price fluctuations. The Parabolic SAR indicator proves valuable in such a scenario. Here’s how traders can use it effectively:
Identifying Trend Direction
The Parabolic Stop and Reverse (SAR) indicator serves as a valuable instrument employed by traders for evaluating the prevailing trend within the market. This indicator aids traders in making informed decisions about their trading positions by examining the positioning of SAR dots in relation to the price fluctuations. These decisions could involve adopting a bullish (long) or bearish (short) stance when trading in the Bitcoin market.
Setting Stop-loss Levels
The dynamic stop-loss levels generated by the Parabolic SAR are represented by dots. These dots shift as the price of an asset changes, allowing traders to safeguard their profits by adjusting their positions. This mechanism also permits traders to capitalize on the upward momentum of a robust trend by allowing their profits to accumulate.
Recognizing Potential Reversals
The Parabolic Stop and Reverse (SAR) indicator is primarily employed to detect possible shifts in market trends. When the SAR dots transition from residing below the price to appearing above it, or vice versa, this shift may suggest an upcoming reversal in the trend direction. Such a signal provides traders with an opportunity to make necessary adjustments to their trading positions based on the anticipated trend reversal.
Limitations and Considerations
Although the Parabolic SAR serves as a valuable tool, it does possess certain limitations. Particularly in market conditions characterized by a lack of clear trend (ranging or sideways markets), this indicator could generate a considerable number of inaccurate signals. To enhance the effectiveness of its application, traders are advised to employ supplementary technical analysis tools that can corroborate the signals provided by the Parabolic SAR.
Conclusion
In the dynamic landscape of cryptocurrency trading, tools like the Parabolic SAR offer traders a means to navigate the intricate terrain of trends and reversals. Particularly in the case of Bitcoin, where price volatility is a constant, the Parabolic SAR can provide valuable insights.To excel in Bitcoin trading, a comprehensive understanding of technical indicators like the Parabolic SAR is crucial. By leveraging its insights, traders can make informed decisions, mitigate risks, and potentially capitalize on profitable opportunities. Remember, the key to successful trading is not only the tools you use but also the knowledge you acquire and the strategies you implement.