

How to calculate the cap rate of an income property before buying it is on the minds of many real estate investors. So, let’s figure it out.
The capitalization rate, or cap rate for short, is one of the two most popular metrics of return on investment in real estate. Still, many investors are not sure what exactly it means, what it measures, and how to calculate it. But without such basic knowledge, it’s impossible to purchase profitable rental income properties.
Table of Contents
- What Is Cap Rate?
- How to Calculate the Cap Rate of an Income Property
- 10 US Markets With the Highest Cap Rates for Income Properties in 2023
- How to Find an Income Property With Strong Cap Rate
In this article, we’ll cover everything that you need to know about the cap rate in residential real estate investing. We’ll start with the definition and the formula and go through how to calculate the said ROI metric in two different ways. Next, we’ll rank the best rental markets for cap rates in 2023 based on Mashvisor’s nationwide market analysis.
We’ll conclude with the steps that you need to take in order to buy an income property with a good cap rate and how the Mashvisor platform can help you along the way.
What Is Cap Rate?
Before knowing how to calculate the cap rate of an investment income property, let’s take a look at what cap rate means and how to use it.
Cap Rate Definition
The cap rate definition marks it as a way to measure the return on investment―or profitability―of an income property. In other words, the cap rate shows the ratio between the money that an investment property generates and the cost of purchasing it.
In addition, the cap rate also evaluates the risk of investing in a particular income property. It makes sense because there is no free lunch in real estate. Higher potential profitability comes with higher risk, too.
That’s why it is important to invest in income properties that provide cap rates within a certain range. If the cap rate is too low, then the rental property will not bring enough ROI. If, alternatively, it’s too high, the investment is too risky and might cause the investor to lose too much.
Cap Rate Formula
Based on the definition provided above, we use the following formula to calculate cap rate:
Cap Rate = NOI/Property Price
NOI refers to the net operating income, or the difference between the annual rental income and the operating expenses required for running a rental business.
The property price, on the other hand, can signify the income property purchase price or its current market value in case it was bought recently.
What Is a Good Cap Rate?
After learning how to calculate the cap rate of an income property they are considering buying, investors should know what value to aim for. There isn’t a single ideal cap rate number; instead, there is a range that real estate professionals recommend in order to strike the right balance between profit and risk.
A good cap rate for an income rental property for sale usually ranges between 8% and 12%. It holds true for both long term and short term rental properties, though, generally speaking, the latter tend to generate higher returns in the current US market.
How to Calculate the Cap Rate of an Income Property
In order to calculate the cap rate for a potential income property, real estate investors need to apply the capitalization rate formula, presented above. However, it is significantly easier said than done. There are several questions that investors must answer before being able to apply the cap rate definition into practice:
- How do you calculate the net operating income (NOI)?
- How do you know the property current market value, especially if you are considering an off market property?
- Where do you find all the real estate and long term or short term rental data that goes into these calculations?
Let’s find the answers to all the above questions by going through the process of how to calculate the cap rate of income properties for sale using a manual process.
Step #1: Calculating the Cap Rate Manually
The first step in computing the capitalization rate of a property that you don’t own yet is finding the best possible source of reliable data to plug into the formula. Unfortunately, there isn’t a single free source of data that is readily available for the needs of small-scale real estate investors, so you’d need to collect analytics from multiple sources.
How to Calculate the Net Operating Income
For this step, you must conduct rental market analysis to find rental comps, which are active rental listings that are similar to the income property that you’re considering.
If you’re thinking of investing in a long term rental property, you can check out websites with such a type of rentals. Some examples include Rent.com, Apartments.com, Rentals.com, Zumper, Zillow, and Hotpads.
If you’d like to purchase a short term rental, you can check out Airbnb, Vrbo, and Booking.com to see what daily rates similar listings charge. But you’d need to estimate the Airbnb occupancy rate on your own to come up with a monthly rental income. Vacation rental websites do not provide such information.
Then, you must check out different sources to forecast rental expenses like property tax, home insurance, property management, utilities, and others. They will depend on whether you plan to run a long term or short term rental business.
In the end, you should subtract the operational costs from the gross income to come up with the NOI. But in addition to requiring a lot of research and calculations, the process is also prone to error. It is because it involves a lot of guesswork and estimation.
Related: Rental Comps: What Are They and Where Can I Find Them?
How to Calculate the Property Price
This step in the process of calculating the cap rate of an income property is more straightforward.
If you’re dealing with an active listing, you can simply check out the asking price. In case you live in a hot seller’s market, you might need to add some more to the asking price for a realistic purchase price. In case it’s a buyer’s market, you might be able to buy the property for less than the listing price.
When analyzing an off market property, on the other hand, you’ll need to figure out what real estate comps, or similar properties, are selling for. Again, it requires checking out multiple properties, conducting property analysis, and estimating the price. You can try to connect with a local real estate agent or investor to ask for prevailing market prices.
If you think that the process described above sounds complicated, imagine how things look when you want to perform rental property analysis on multiple income properties for sale. You’d need a lot of time to do that, and chances are other, more experienced investors will snatch all the good opportunities before you.
Related: Airbnb Market 2023 Trends, Data, and Analysis
Step #2: Using the Mashvisor Cap Rate Calculator
Using an investment property calculator like the one available on Mashvisor offers an easier, more efficient, and more accurate way to calculate the cap rate of a potential income property. All you need to do is to enter the address of the property that you have in mind in order to access detailed analysis. The analysis includes the expected cap rate, as well as other ROI metrics.
The Mashvisor cap rate calculator works both with short term and long term rental properties. It means that you can analyze both types of income properties, depending on your preferred strategy. Moreover, you can use the calculator to decide on the best rental strategy for any income property if you just want to maximize property ROI.
The best thing about the Mashvisor tool for calculating cap rates is that all the data comes from reliable sources like the MLS, Airbnb, Zillow, Redfin, and public records. It goes through Mashvisor’s proprietary AI-driven machine-learning algorithms to accurately estimate the expected cap rate of any US income property.
So, all calculations and rental data analytics are based on the performance of comps. In this way, with a few clicks of a button, you can calculate the cap rate of both on market and off market properties.
To get access to the Mashvisor cap rate calculator for income properties, sign up for a 7-day free trial.
10 US Markets With the Highest Cap Rates for Income Properties in 2023
Now that you know how to calculate the cap rate of any income property in the US housing market, you are probably wondering where to get started with your profitable investments. Well, the first step is identifying the best markets for your selected rental strategy.
To help you out, we’ve ranked the top 10 locations for rental income property investments in 2023: the five best long term rental markets and the five best short term rental markets. We used Mashvisor nationwide real estate market analysis from April 2023 to identify the locations with the highest cap rate by city for both strategies.
We focused on markets with median property values before $1 million for affordability and with more than 100 rental listings for strong rental demand. To give you some context, it is about three times the national median property price of $334,269, as reported by Zillow.
So, the best markets for investing in income properties this year include:
5 Best Cities for Long Term Rental Cap Rates in 2023
If you’d like to invest in a long term rental property, we recommend looking into the following locations:
1. Alva, FL
- Median Property Price: $642,439
- Average Price per Square Foot: $302
- Days on Market: 104
- Number of Long Term Rental Listings: 137
- Monthly Long Term Rental Income: $3,691
- Long Term Rental Cash on Cash Return: 5.06%
- Long Term Rental Cap Rate: 5.11%
- Price to Rent Ratio: 15
- Walk Score: 20
2. Ventnor City, NJ
- Median Property Price: $526,107
- Average Price per Square Foot: $307
- Days on Market: 80
- Number of Long Term Rental Listings: 162
- Monthly Long Term Rental Income: $3,409
- Long Term Rental Cash on Cash Return: 4.42%
- Long Term Rental Cap Rate: 4.48%
- Price to Rent Ratio: 13
- Walk Score: 74
3. Schaumburg, IL
- Median Property Price: $309,482
- Average Price per Square Foot: $260
- Days on Market: 41
- Number of Long Term Rental Listings: 522
- Monthly Long Term Rental Income: $2,129
- Long Term Rental Cash on Cash Return: 4.31%
- Long Term Rental Cap Rate: 4.40%
- Price to Rent Ratio: 12
- Walk Score: 48
4. Lancaster, CA
- Median Property Price: $455,130
- Average Price per Square Foot: $284
- Days on Market: 92
- Number of Long Term Rental Listings: 186
- Monthly Long Term Rental Income: $2,556
- Long Term Rental Cash on Cash Return: 4.29%
- Long Term Rental Cap Rate: 4.34%
- Price to Rent Ratio: 15
- Walk Score: 60
5. Glen Burnie, MD
- Median Property Price: $421,211
- Average Price per Square Foot: $394
- Days on Market: 59
- Number of Long Term Rental Listings: 175
- Monthly Long Term Rental Income: $2,248
- Long Term Rental Cash on Cash Return: 4.00%
- Long Term Rental Cap Rate: 4.06%
- Price to Rent Ratio: 16
- Walk Score: 84
5 Best Cities for Short Term Rental Cap Rates in 2023
If you prefer to buy a vacation rental for sale, it’s worth checking out the markets below:
1. Harvey, LA
- Median Property Price: $341,114
- Average Price per Square Foot: $156
- Days on Market: 49
- Number of Short Term Rental Listings: 1,029
- Monthly Short Term Rental Income: $3,944
- Short Term Rental Cash on Cash Return: 8.27%
- Short Term Rental Cap Rate: 8.42%
- Short Term Rental Daily Rate: $202
- Short Term Rental Occupancy Rate: 56%
- Walk Score: 52
2. Rileyville, VA
- Median Property Price: $353,448
- Average Price per Square Foot: $234
- Days on Market: 7
- Number of Short Term Rental Listings: 154
- Monthly Short Term Rental Income: $4,105
- Short Term Rental Cash on Cash Return: 8.15%
- Short Term Rental Cap Rate: 8.27%
- Short Term Rental Daily Rate: $235
- Short Term Rental Occupancy Rate: 56%
- Walk Score: 10
3. Columbia, MO
- Median Property Price: $273,020
- Average Price per Square Foot: $132
- Days on Market: 151
- Number of Short Term Rental Listings: 289
- Monthly Short Term Rental Income: $2,837
- Short Term Rental Cash on Cash Return: 7.78%
- Short Term Rental Cap Rate: 7.98%
- Short Term Rental Daily Rate: $145
- Short Term Rental Occupancy Rate: 56%
- Walk Score: 30
4. Columbia Heights, MN
- Median Property Price: $292,297
- Average Price per Square Foot: $150
- Days on Market: 24
- Number of Short Term Rental Listings: 314
- Monthly Short Term Rental Income: $3,693
- Short Term Rental Cash on Cash Return: 7.69%
- Short Term Rental Cap Rate: 7.83%
- Short Term Rental Daily Rate: $159
- Short Term Rental Occupancy Rate: 57%
- Walk Score: 82
5. Bar Harbor, ME
- Median Property Price: $621,900
- Average Price per Square Foot: $402
- Days on Market: 113
- Number of Short Term Rental Listings: 297
- Monthly Short Term Rental Income: $6,594
- Short Term Rental Cash on Cash Return: 7.68%
- Short Term Rental Cap Rate: 7.75%
- Short Term Rental Daily Rate: $321
- Short Term Rental Occupancy Rate: 65%
- Walk Score: 77
Note: The above-listed cities might face different Airbnb laws and regulations, and it’s your responsibility as an aspiring host to check them out to ensure legality. You can start with the Mashvisor short term rental regulations page where you can find a summary of all major markets.
How to Find an Income Property With Strong Cap Rate
Before we conclude our guide on how to calculate the cap rate of income properties for sale, we need to discuss the steps that go into locating listings with high values for the ROI metric.
So, let’s take a look.
Step #1: Choose a Market With Good Average Cap Rate
The first step in any real estate investing decision is finding an appropriate location. The market where you invest determines a lot of factors that eventually determine what cap rate your income property will generate.
But how do you find locations with a good cap rate?
You can use the Mashvisor Market Finder for this purpose. The tool works with both long term and short term rental properties. It can help you locate good states, cities, and even neighborhoods for your real estate investments.
All you need to do is to enter the following criteria:
- Rental strategy: Long term vs short term
- Mashmeter score: Mashvisor’s own evaluation of how good a market is for investing in income properties
- School ranking
- Crime and safety
- Regulatory environment score
- Home value
- Property type
- Expected rental income
- Expected occupancy rate
- Expected cap rate
As soon as you set up the expected cap rate between 8% and 12%, you will get a list of the top markets for investing in rental properties of your preferred strategy. In this way, you can forget about any other manual long term or Airbnb market research or analysis.
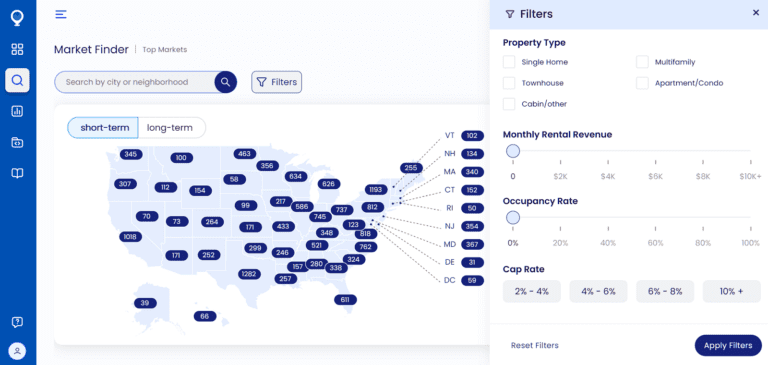
You can use Mashvisor’s Market Finder to find locations with a good cap rate―states, cities, and neighborhoods for your real estate investment.
Step #2: Search for Properties for Sale With Strong Potential
The second step is to look for available properties for sale that promise to bring a good cap rate. White there are many house hunting apps, there are only a few good investment property websites. Most online and offline sources of real estate listings focus on homes for sale and not income properties for sale.
Mashvisor is an exception. Our platform provides MLS listings and off market properties that have the potential to turn into profitable income property investments. All you need to do in order to uncover them is to use the Property Finder.
The tool allows you to search for listings based on the following criteria:
- Location
- Budget
- Rental strategy
- Type of property
- Number of bedrooms
- Number of bathrooms
When you enter your preferences, the smart Property Finder will provide you with the properties that match your criteria, starting from the most profitable opportunities first. The income properties on top are guaranteed to bring the best cap rate.
Related: 5 Ways to Find Investment Property for Sale Near Me
Step #3: Analyze the Potential Cap Rate of Income Properties for Sale
The third step is to confirm the ROI of the properties that you locate with the help of the Property Finder. Another Mashvisor tool that can help you is the rental property calculator. Also known as the cap rate calculator, this tool performs detailed investment property analysis, going beyond the capitalization rate.
The Mashvisor calculator estimates:
- Property price
- One-time startup costs
- Rental income
- Recurring operating costs
- Financing costs
- Cash flow
- Occupancy rate
- Cash on cash return
- Cap rate
Such a level of analysis is provided both for the long term and short term rental strategies so that you can tailor your investment decisions. You can compare which approach will bring the highest return for any particular income property.
All in all, instead of calculating the cap rate manually, you can do that much easier, faster, and more accurately with the help of the Mashvisor income property calculator.
Finding Income Properties With Good Cap Rate
Knowing how to calculate the cap rate of an income property is a must for real estate investors. However, doing it in a manual manner is optional. The savviest and smartest investors know that doing manual data collection and calculations in the era of high-tech is a waste of time and energy. That’s why they seek the best real estate investment tools to improve their work.
The Mashvisor website provides a comprehensive real estate investing platform with all the necessary tools to find income properties with a good cap rate. With the Market Finder, you can locate the best locations for long term and short term rentals, starting from the state, going through the city, and all the way to the neighborhood.
You can use the Property Finder to identify MLS listings and off market properties with the best ROI in any US market. With the rental property calculator, you can conduct detailed analysis to confirm that a property will bring a good cap rate before even buying it.
To learn more about how Mashvisor can help you calculate the cap rate of potential income properties, schedule a demo with our team of experts.