
Trustworthy single family rental data is key to making an investment that returns a profit. This guide will explain the latest data insights.
In 2022, the rental market saw some drastic changes, and it will keep changing rapidly in 2023. Access to rental data ensures you won’t make an investment that brings your portfolio down, for instance, a single family rental in an overpriced market that’s going to decline.
Table of Contents
- How Was the Single Family Rental Market in 2022?
- What Will the Single Family Rental Market Be Like in 2023?
- The Best Source for Single Family Rental Data
In this article, we’ll go through the largest single family rental trends of 2022, take a look at how they will manifest in 2023 and onward, and show ways in which you can find data on your own.
The real estate market is really varied across the US, and generalized nationwide data can only be used to make a general decision of whether to invest or not at this time.
If you want to understand what property is a good investment, you want to look at the specifics. They include economic data on the neighborhood, demand and supply, rent and house price growth dynamics, how much upfront investments a property needs, etc.
It is too specific for national data, and you need to find that information with a specialized tool like Mashvisor. You’ll find more information on this tool later in the article.
How Was the Single Family Rental Market in 2022?
2022 and the new decade, in general, offer a lot of new developments for the single family rental market. Both COVID-19 and the 2022 economic crisis caused by the war in Europe significantly impacted the US market. Let’s look at a brief summary of what the market looked like in 2022.
The Pandemic Housing Market Boom Slows
Economists foresaw a major recession in 2020 when COVID-19 hit the US and health authorities imposed lockdowns. But the recession didn’t touch the real estate housing market; instead, home sales and home prices boomed.
Individual buyers stuck at their homes wanted to upgrade and achieve more space, and investors were looking for a way to diversify their portfolios in times of economic uncertainty. As a result of everybody competing for real estate, the average home price in the US grew 45% from 2019 to 2022.
In 2022, however, the housing market started to slow down. It is partly due to the housing prices growing so much, but in a large part due to the Federal Reserve taking action.
The Fed did several interest rate hikes, making it harder for an average family to take out a mortgage. It forced many potential buyers to either lower expectations or go back to renting for another couple of years.
As a result, the meteoric rise of house prices slowed down quite a bit. In the summer of 2022, month-over-month growth dropped from 1.5% to negative numbers, as noted by Federal Housing Finance Agency.
Interest Rates and Inflation Grow
Two major factors in the real estate market stalling are interest rates and inflation.
In 2019, the Fed cut interest rates down to 1.5%. It was one of the major drivers of post-COVID real estate investment. Mortgages were a lot more affordable, so both individual buyers, and investors could take on growing house prices and compete for the existing supply of housing.
In 2022, however, the Fed went on to raise interest rates seven times. The current interest rate is three times higher at 4.5%. It’s likely to do another hike soon in 2023.
Mortgage rates rose in response, doubling during the course of the year from an average of 3.2% to 6.6%.
If you take out a mortgage now as opposed to the beginning of 2022, you’re going to end up paying twice as much interest over the course of the mortgage period. For a median-priced home, that’s around $200,000 more.
Add growing inflation to the drawing board, and it’s clear why the market is slowing down. Financing is a lot less available and now that housing prices have grown since 2019, it matters even more.
Related: How to Get the Best Mortgage Rate for Investment Property in 2023
Sales Fall
Since access to financing decreased, so did sales. In 2022, sales in the single family housing market reached a four-year low.
The decline was partly due to homeowners being anxious about selling off their properties because of rising mortgage rates. Home equity might have grown since 2019, but they’d have to finance their new home at a much higher rate. As a result, many hold off the sale.
On average, there was a 20% decrease in active listings across the US compared to 2021.
The situation with sales differs greatly across the US, though. In some markets, it’s not unusual to see properties spend months without an offer. In others, properties are taken overnight.
If you’re trying to figure out whether to sell or buy a single family rental, it’s best to take a look at rental data in your specific area. Look for time on the listing or a similarly named statistic to see what’s the average time a property spends on a listing before being sold.
Demand Exceeds Supply
Despite the turmoil, demand still exceeds supply in the housing market, in part because of the significant decrease in supply quite a lot after interest rate hikes.
In late 2022, average housing price indexes showed a drop in price by around 0.2% monthly, but most experts conclude it’s a temporary development. In most areas of the US, housing prices will continue to grow, even though much slower than in 2019-2021.
What Will the Single Family Rental Market Be Like in 2023?
The single family rental market saw several drastic changes in 2022. But will the trends continue in 2023, or will they change? Let’s take a look at several key trends that are likely to define 2023.
Rent Is Up
Since mortgage rates doubled in 2022, many younger people who were looking to buy their first single family housing found that they couldn’t afford the payments. Contrary to the record-breaking growth of 1.3% in home ownership in 2020, far fewer people are buying their first single family home in 2022.
Families are turning back to rentals for housing. In the first quarter of 2022, investors bought 28% of single family rentals, indicating high expectations for the rental market.
The rent cost is also up and will continue to increase in 2023. The rate of growth will be a bit slower, though.
In the last couple of years, it was not uncommon to see rent go up 15% year-over-year. Rents are likely to grow for single family units in 2023 as wel,l but by around 7-10%.
With home prices and mortgage rates going up as well, the rent increase won’t necessarily transfer to profit. It may be eaten up by increased mortgage payments and inflation.
It takes a lot of calculations to estimate whether a particular single family rental is going to turn a profit now that prices and interest rates change so quickly. If you’re considering entering the market now, use a rental calculator to estimate your potential cash flow and cash on cash return.
Related: Airbnb Rental Calculator: The Ultimate Tool for Airbnb Hosts for 2023
Home Values Will Depreciate in Some Areas
In the last few months of 2022, national prices of single family rentals actually fell 0.2% instead of growing. But that’s hardly the beginning of a bigger trend. More likely, the average price decrease is a short-term reaction to the growing mortgage rates and general housing market turmoil.
That said, the booming market in the last couple of years for sure made some areas overvalued. Investors tend to flock to the next new thing, be it a tech company or a town that seems popular with tenants. It often creates a situation where single family investment properties cost more than they’re actually worth.
In 2023, it’s likely that the overvalued markets are going to depreciate. Places, where the home price increases was caused by competing investors rather than actual demand from tenants, are going to experience negative growth.
If you’re trying to get into the housing market in 2023, your job is figuring out whether the area you want to buy in is one of the said places. Otherwise, you’ll purchase a home that’s going to cost less in ten years.
Housing Market Factors to Watch Out for
Here are some factors you should look at:
- Significantly high year-over-year growth
- Often appeared in “best real estate markets” lists
- Price decrease in Q4 2022 and Q1 2023 is higher than the national average
- High vacation rate
- Long time on listing before the property is rented out
- Poor neighborhood infrastructure
- Rent rates produce a low or negative cash flow
Single family rentals in such areas will likely be a financial burden instead of a good investment. If you think the area is great but it shows some of the above factors, it’s best to wait for a year or two for the price to settle.
Despite some areas being destined to depreciate, others will grow still. Investors who want to purchase a single family rental that will turn a profit need to find a healthy market first. It ensures the property will appreciate and the cash flow is going to be a net positive.
Mortgage Rates Will Remain High
In case you were hoping the mortgage rates would fall in 2023, it’s probably not going to happen. The Fed is planning another interest rate hike in early 2023. However, this time, it’s going to be much lower than in 2022. It’s planned to increase by 0.25, as opposed to 0.75 hikes.
In any case, mortgage rates are predicted to grow even further in 2023, even though not as dramatically as before. With the current level of inflation still high, it’s highly unlikely that the interest rates are going down any time soon.
So in terms of real estate financing, now may be the best time to take out a loan. It’s only getting costlier in 2023.
The interest rates may get back to pre-2022 levels, but only after the US and the world economy return to exponential growth. When that’s going to happen is a hard question to answer, so you can safely assume mortgage rates will remain relatively high for another couple of years.
Tenant Preferences Change
The three trends above are the key economic factors that are going to define 2023’s housing market. There’s another trend you should consider. Tenants’ preferences in housing have changed a bit since 2019, and it manifests even more in 2023.
During the COVID-19 lockdowns, people were spending more time indoors, and the trend continues. Many workspaces are moving towards a hybrid model where workers can work from home most of the week. Some are even embracing a fully remote work model.
It makes a home office a necessity in a modern single family home.
If you’re looking for the best vacation rental property, make sure they suit tenants. Find single family rentals that provide or can be remodeled to provide diversified spaces, such as an office space, home gym, outdoor garden, etc.
Since an average office worker may not spend as much time commuting to and from work, they want facilities like schools, restaurants, and small businesses closer to their community. It’s not always possible for them to be within walking distance, but the closer they are, the better.
Related: How to Make a Rental Property More Desirable to Prospective Tenants
The Best Source for Single Family Rental Data
Now, you know the general outlook on the single family rental data as we enter 2023. But to make a good investment decision, obtaining general data is not enough.
Some areas will depreciate, while others will continue growing at a more sustainable rate. To make a real estate investment in 2023, you need to understand the type of location you’re dealing with. To do so, you’ll need the following data points for the neighborhood:
- Historical data on house prices
- Historical data on average rent
- Historical data on the vacancy rate
- Historical data on an average nightly fee for short term rental
- Data on neighborhood walkability
- Data on neighborhood infrastructure
- MLS data like time on the listing, number of active listings, etc.
With historical data points, you can calculate whether the prices of single family rentals and average rent are going up or down the in the area. Neighborhood data can show whether it’s a good place to live. Additionally, MLS technical data can show whether there’s a significant demand in the area.
Using Mashvisor
Mashvisor provides all the above data points. It is a data-driven tool for real estate investors that gives them access to both single family rentals for sale and data analytics for the rentals.
Mashvisor takes data for rental analysis from the most popular real estate platforms. The platform obtains data on pricing from ListHub, one of the largest aggregators of real estate listings. Data on long term rentals are taken from RentPads, HotPads, and Zillow, while short term analytics comes from parsing Airbnb data.
Unlike many other companies that offer large data sets on the real estate market, Mashvisor is created to be as intuitive as possible. You don’t need to run custom analytics on a large data set; Mashvisor does it for you.
The platform goes even further and provides rental data for each property. For every single family rental you see on Mashvisor’s property finder, you see an estimate of cash on cash return and cap rate.
The said metrics are calculated for both long term and short term rentals. Mashvisor uses the price of each single family rental and the average mortgage rate to calculate rental expenses and weighs them against the average rent in the area.
Of course, it is just a rental estimate based on averages. If you can get better conditions on a mortgage or the rental needs renovation, the metrics may change quite a bit. But it’s still a good way to get a general idea of whether the property at hand is good or not.
In case you want to see a more precise estimate of key metrics, use Mashvisor’s cap rate calculator.
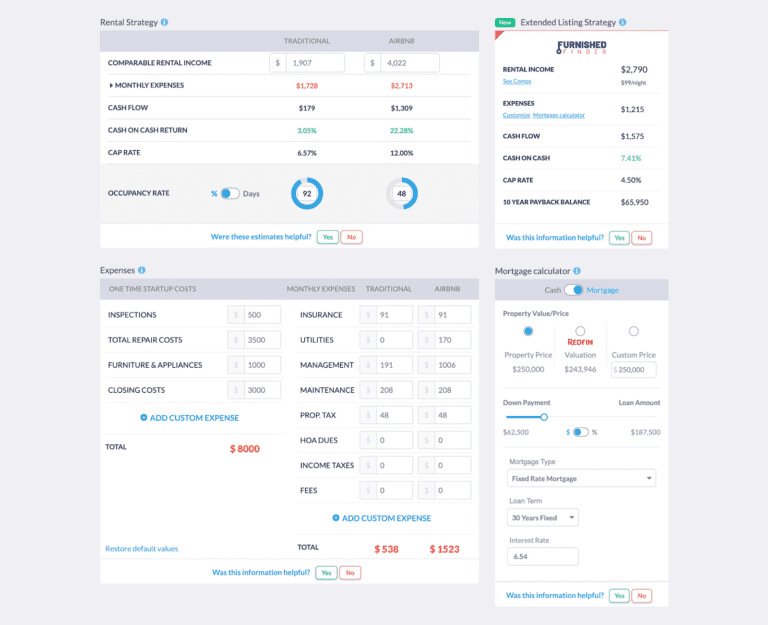
Mashvisor’s rental calculator allows taking every expense into account.
The calculator lets investors change the values that are used to calculate mortgage and rental expenses. As a result, the cash on cash return, cap rate, and cash flow are a lot closer to reality than the generalized estimate.
You can’t predict rental expenses perfectly, but you can make an educated guess with the Mashvisor calculator. Run different scenarios with lower-than-average income or occupancy rates to see at what point the property stot being profitable.
If you want to give the calculator a try or find single family rental properties accompanied by rental comps, sign up for a 7-day free trial now.
Conclusion
2022 saw the post-COVID real estate market boom stop. 2023 may be the year we return to more stable growth, with a few overvalued markets depreciating. Such a situation calls for informed and careful investment decisions.
You can get nationwide single family rental data from various sources. While most of them offer data sets that are free, users are left to run data analytics on their own.
Mashvisor makes real estate analytics more accessible to the average independent investor. Most of the local data analytics is done for you on the platform, and you only need to make decisions based on the insights. More advanced analytics options are also available.
Want to give Mashvisor a try? Book a demo today and a product specialist will walk you through every aspect of the platform.