

Buying a profitable short term rental requires using reliable and comprehensive Airbnb rental statistics by city. So, where do you find them?
In 2023, investing in short term rentals promises to remain an excellent real estate investing strategy. However, due to the increased competition from beginner and experienced investors, it’s crucial to choose a location with a strong potential. And doing it requires using the best Airbnb rental statistics by city.
Table of Contents
- 6 Airbnb Rental Statistics You Need to Evaluate Your Investment
- How to Access Airbnb Rental Statistics by City
- Airbnb Rental Statistics by City in the US as of November 2022
- Get Started With the Most Reliable Airbnb Rental Data Now
But it is easier said than done. The problem that many vacation rental investors face is locating the top sources of Airbnb statistics in the US market. Contrary to popular belief, Airbnb, Vrbo, and other short term rental marketplaces do not provide data and analytics in a form that investors can easily use to make decisions. So, they need to resort to other data sources.
In this article, we will show you the key Airbnb statistics that you need in order to evaluate the feasibility and profitability of a market for investing in Airbnb rental properties. We will also point you to the top source for reliable short term rental data. (Hint: The Mashvisor platform gives you all the data that you need to invest in Airbnb).
Last but not least, we will provide you with a list of the best short term rental markets in the US based on the most important Airbnb data points, according to Mashvisor’s nationwide analysis.
Let’s get started!
6 Airbnb Rental Statistics You Need to Evaluate Your Investment
As we all know, location is arguably the most important factor when investing in real estate. It holds true for Airbnb rental properties as much as for long term rentals, possibly even more. That’s why it’s crucial to make your investment location decisions based on solid information, data, and analytics.
While there are many numbers that go into choosing a top short term rental market, here are the main Airbnb statistics by city to consider as a real estate investor:
1. Number of Airbnb Listings
When buying Airbnb for sale, you want to select a popular tourist destination where demand for short term rentals is strong. You also need to consider the local short term rental regulations and focus on markets that allow non-owner occupied short term rentals. Otherwise, you cannot buy an investment property for the sole purpose of renting it out on Airbnb.
One easy and straightforward way to ensure that you invest in a location where the Airbnb industry is thriving is to look at the number of active Airbnb listings. But it’s important to compare the number of Airbnb rentals to the size of the real estate market. For example, having 100 short term rental listings in Joshua Tree might be better than having 5,000 listings in NYC.
2. Airbnb Daily Rate
Another piece of Airbnb rental data that you need to consider when searching for the best location is the Airbnb daily rate. It is the same as the nightly rate and measures how much Airbnb hosts ask guests to pay to spend a night at their property.
The importance of the Airbnb daily rate stems from the fact that, along with the occupancy rate, it determines the monthly rental income, which, in turn, determines the return on investment.
Generally speaking, locations with the highest Airbnb nightly rates are more likely to provide profitable investment opportunities. Of course, you also need to consider them relative to median property prices and the recurring monthly expenses for running an Airbnb business. You must find the right balance between revenue and costs.
3. Airbnb Occupancy Rate
An even better way to measure Airbnb demand in a market is to use the average occupancy rate. The Airbnb occupancy rate gives more comprehensive information than the number of Airbnb listings alone, as it considers the balance between supply and demand.
The metric comprises the ratio between the days for which a property is rented out compared to the days for which the host has made it available for renting. It can be presented as a number or – more frequently – as a percentage.
Multiplying the average occupancy rate for Airbnb rental properties by the average nightly rate gives us the average short term rental income in a city.
4. Airbnb Rental Income
The Airbnb rental income, or Airbnb revenue, is the amount of money that a real estate investor makes from guests within a month or a year. That’s one of the most important Airbnb rental statistics by city as it’s present in the cash flow formula, as well as all ROI formulas in real estate.
The difference between the rental income and the rental expenses, also known as cash flow, is what you pocket after covering all costs related to running a vacation rental business. The more money you are able to pocket, the higher your profitability is. That’s the reason why you should look at the average monthly Airbnb income in a location when deciding whether to invest there.
Related: Four Effective Ways to Increase Your Airbnb Revenue
5. Airbnb Cash on Cash Return
Investors buy short term rental properties for sale in order to make money from them, also known as return on investment. And one of the most popular metrics for real estate ROI is the cash on cash return. It is the ratio between the annual before-tax income over the total cash investment.
The cash on cash return is the most comprehensive Airbnb statistic that measures the rate of return because it considers the method of financing the purchase of an investment property. At the property level, values above 8% are usually considered a good cash on cash return. However, at the city level, averages of about 4%-5% indicate a market with a strong potential.
6. Airbnb Cap Rate
The final Airbnb statistics by city that you should look at when choosing a promising location is the Airbnb cap rate. The cap rate is another ROI metric in real estate investing. Unlike the cash on cash return, it doesn’t factor in the financing method, making it less comprehensive but easier to calculate.
That’s why the cap rate is usually the first profitability number we use to compare between a few different markets and a few different vacation rentals for sale. Once we’ve done our preliminary research, we can introduce the cash on cash return when expanding and deepening our Airbnb market research and analysis.
How to Access Airbnb Rental Statistics by City
Now that you know the Airbnb data analytics by city that you need, the question becomes: Where can I find Airbnb statistics?
You can find all the Airbnb statistics and data analytics that you need right here at Mashvisor.
While having access to Airbnb rental statistics by city is great, city-level data is not detailed enough to help investors land the optimal location for short term rentals. The performance of investment properties varies not only from city to city but also from neighborhood to neighborhood within the same city.
That’s why the Mashvisor real estate investing app provides you with access to neighborhood-level Airbnb data in all US cities and towns, no matter how big or small. Meanwhile, for city-level statistics, you can refer to our real estate investment blog, especially the Airbnb Rentals and Top Locations sections.
Related: How to Find Reliable Airbnb Rental Data
Neighborhood-Level Airbnb Statistics
There are two tools available on Mashvisor that help you conduct neighborhood analysis focused on the performance of Airbnb investment properties.
First, you can use our real estate heatmap to look for areas with high Airbnb rental income, high Airbnb occupancy rate, and high Airbnb cash on cash return, as well as low home values. With the heatmap tool, you can locate a few neighborhoods that offer profitable opportunities.
Second, you can continue your market research with the Mashvisor neighborhood analysis pages. There, you will find average values for all Airbnb statistics that you need, including the rental income, the occupancy rate, and the cash on cash return.
Moreover, you can evaluate the overall potential of the area through the Mashmeter score and confirm that Airbnb is the optimal rental strategy in this location.
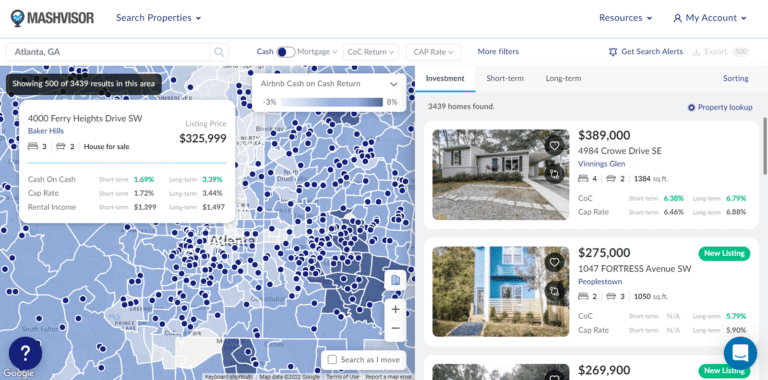
You can use Mashvisor’s real estate heatmap tool to search for profitable neighborhoods based on Airbnb cash on cash return, cap rate, rental income, and occupancy rate.
Property-Level Airbnb Statistics
Once you’ve chosen the best short term rental markets, it’s time to start your Airbnb investment property search. With Mashvisor’s search engine and Property Finder, you can input your specific criteria and get a list of MLS listings and off market properties that meet your expectations.
Each Airbnb for sale comes with detailed rental property analysis conducted by the Mashvisor Airbnb profit calculator. The calculator provides all must-have Airbnb statistics by property to ensure positive cash flow and high ROI.
Importantly, the data which Mashvisor uses in the real estate market analysis and the investment property analysis comes from reliable sources like the MLS and Airbnb itself. In its analysis, Mashvisor looks at the performance of Airbnb rental comps to evaluate how a property for sale is expected to behave if rented out on a short term basis.
The availability of nationwide city, neighborhood, and property Airbnb statistics and the trustworthy sources of data make Mashvisor the best source of information for Airbnb hosts.
To get immediate access to the best Airbnb data in the US market, sign up for a 7-day free trial of Mashvisor.
Airbnb Rental Statistics by City in the US as of November 2022
If you’re looking for the best place to find Airbnb city-level data, the chances are that you’re planning to invest in a short term rental property. To help you select the top location for this rental strategy, we conducted nationwide real estate market analysis. As a result, we ranked the 10 best US cities for each of the main Airbnb statistics discussed above.
Note: The data presented below is accurate as of the beginning of November 2022. Furthermore, we’ve included markets that might face various Airbnb laws and regulations. It is your duty as a real estate investor to ensure that your chosen location allows non-owner occupied short term rentals.
10 US Cities With the Most Number of Airbnb Listings
Wondering: What city uses Airbnb the most?
Here are the 10 US markets with the highest number of active Airbnb rental properties:
| Ranking | City/State | Number of Airbnb Listings |
| 1 | New York, NY | 7,088 |
| 2 | Los Angeles, CA | 6,515 |
| 3 | Atlanta, GA | 5,423 |
| 4 | San Diego, CA | 5,094 |
| 5 | Houston, TX | 4,938 |
| 6 | Miami, FL | 4,004 |
| 7 | Austin, TX | 3,763 |
| 8 | Chicago, IL | 3,479 |
| 9 | Seattle, WA | 3,435 |
| 10 | Nashville, TN | 3,425 |
So, if you’re looking for the markets with the most short term rental properties as one indicator of Airbnb demand, you can start with the 10 cities listed above. However, keep in mind that most of them have enacted strict vacation rental regulations and restrictions.
10 US Cities With the Highest Airbnb Daily Rate
As we said above, the Airbnb nightly rate is one of the main determinants of cash flow and return on investment for short term rentals. That’s why we listed the top 10 US locations for Airbnb daily rate:
| Ranking | City/State | Number of Airbnb Listings | Airbnb Daily Rate |
| 1 | Malibu, CA | 285 | $1,057 |
| 2 | East Hampton, NY | 478 | $930 |
| 3 | Southampton, NY | 266 | $918 |
| 4 | Paradise Valley, AZ | 108 | $829 |
| 5 | Montauk, NY | 252 | $789 |
| 6 | Sag Harbor, NY | 193 | $779 |
| 7 | Remsenburg, NY | 135 | $748 |
| 8 | Aspen, CO | 196 | $699 |
| 9 | San Leandro, CA | 104 | $650 |
| 10 | Coachella, CA | 123 | $592 |
10 US Cities With the Highest Airbnb Occupancy Rate
If you’d like to know: Where are high demand areas in Airbnb?
Then, you should look at the markets with the highest Airbnb occupancy rates in the US:
| Ranking | City/State | Number of Airbnb Listings | Airbnb Occupancy Rate |
| 1 | Madison, WI | 237 | 73% |
| 2 | Bellingham, WA | 164 | 73% |
| 3 | West Allis, WI | 112 | 70% |
| 4 | Newton, MA | 228 | 70% |
| 5 | Hauula, HI | 131 | 69% |
| 6 | Hawaiian Gardens, CA | 166 | 68% |
| 7 | Olympia, WA | 126 | 68% |
| 8 | Summerville, SC | 118 | 67% |
| 9 | Roanoke, VA | 169 | 67% |
| 10 | Fullerton, CA | 141 | 67% |
Related: What Airbnb Occupancy Rate Can You Expect in the US Market?
10 US Cities With the Highest Monthly Airbnb Rental Income
If you’re looking for places with top short term rental income, you can find them here:
| Ranking | City/State | Number of Airbnb Listings | Airbnb Rental Income |
| 1 | Hauula, HI | 141 | $9,737 |
| 2 | Napa, CA | 334 | $9,478 |
| 3 | Kailua, HI | 184 | $9,240 |
| 4 | Palos Verdes Estates, CA | 261 | $9,062 |
| 5 | Sonoma, CA | 392 | $9,050 |
| 6 | Kahuku, HI | 198 | $8,926 |
| 7 | Kapolei, HI | 176 | $8,608 |
| 8 | Rumson, NJ | 158 | $7,938 |
| 9 | Encinitas, CA | 403 | $7,862 |
| 10 | Haleiwa, HI | 183 | $7,746 |
10 US Cities With the Highest Airbnb Cash on Cash Return
While all other Airbnb rental statistics by city are crucially important because they determine ROI, the most important data point is the actual return you can expect in a market.
So, where are Airbnbs most profitable?
In the locations with the best Airbnb cash on cash return, such as:
| Ranking | City/State | Number of Airbnb Listings | Airbnb Cash on Cash Return |
| 1 | Schiller Park, IL | 110 | 7.85% |
| 2 | Reading, OH | 171 | 7.85% |
| 3 | Shaler, PA | 187 | 7.71% |
| 4 | West Saint Paul, MN | 320 | 7.70% |
| 5 | Nashville, IN | 152 | 7.59% |
| 6 | White Settlement, TX | 166 | 7.52% |
| 7 | Pleasantville, NJ | 402 | 7.50% |
| 8 | Bellwood, IL | 152 | 7.45% |
| 9 | Richmond Heights, OH | 234 | 7.45% |
| 10 | Harvey, LA | 466 | 7.42% |
10 US Cities With the Highest Airbnb Cap Rate
Last but not least, we used the Mashvisor nationwide Airbnb market analysis to rank the best short term rental markets based on cap rate. The cap rate metric give investors a quick overview of the most profitable locations for the short term rentals:
| Ranking | City/State | Number of Airbnb Listings | Airbnb Cap Rate |
| 1 | Reading, OH | 171 | 8.14% |
| 2 | Schiller Park, IL | 110 | 8.10% |
| 3 | Shaler, PA | 187 | 7.98% |
| 4 | West Saint Paul, MN | 320 | 7.86% |
| 5 | Pleasantville, NJ | 402 | 7.81% |
| 6 | Nashville, IN | 152 | 7.77% |
| 7 | Bellwood, IL | 152 | 7.69% |
| 8 | White Settlement, TX | 166 | 7.67% |
| 9 | Richmond Heights, OH | 234 | 7.63% |
| 10 | Harvey, LA | 466 | 7.56% |
As you can see from the city-level Airbnb rental data above, the best locations for investing in Airbnb based on cash on cash return and cap rate are basically the same. They are simply the cities where you can expect the highest ROI for short term rental properties.
Get Started With the Most Reliable Airbnb Rental Data Now
In 2023, profitable short term rental investment decisions will be the ones based on solid technology-driven data and analytics. And the first step in making them is finding the best markets with the help of reliable Airbnb rental statistics by city.
The most important metrics to look at in your vacation rental market analysis (as well as investment property analysis) include the following:
- Number of Airbnb listings
- Airbnb daily rate
- Airbnb occupancy rate
- Airbnb rental income
- Airbnb cash on cash return
- Airbnb cap rate
The Mashvisor platform helps you access quickly and efficiently not only Airbnb data for cities and neighborhoods but also for individual properties for sale. With the help of Mashvisor, you can find top-performing short term rental properties with a few clicks of a button.
To make 2023 your most profitable yet, sign up for a 7-day free trial of Mashvisor today.