
The US rental market continues to suffer from the ill effects of inflation. At present, what do authorities say about rent growth in the US?
According to the latest Consumer Price Index (CPI), rent growth continued to accelerate in the past few months. However, according to CNBC senior real estate correspondent Diana Olick, the numbers presented are inaccurate and lagging by several months. It is mainly due to how the Bureau of Labor and Statistics calculates the numbers.
Rent growth cooled down significantly in September 2022, according to Realtor.com. It marks the second consecutive month that rent growth slowed to a single digit or 7.8% year-over-year for a 0-2 bedroom unit. It also represents the second month-over-month decline in eight months, down from its peak in July.
However, despite the easing in rent growth, rental rates are still rising at twice the pace since March 2020.
RedFin also provides similar numbers and notes a significant increase in apartment construction. According to RedFin, rent is growing half as fast as it did six months earlier. It is expected to cool rents even further as the housing supply slowly catches up.
One major factor preventing new renters from moving into rental properties is inflation. The third quarter is typically considered a strong leasing period; however, the demand for long-term rentals is down this year.
Rental rates for single-family homes are also lower than their record highs in April 2022 but are still considered high. Single-family rent prices are particularly affected by the high demand for such types of properties.
Related: Median US Home Prices Up 46% Since Start of Pandemic
What Does This Mean for Rental Investors?
At face value, the CPI numbers may look good for people who are seriously considering getting into real estate investing. Many investors may take it as an excellent opportunity to take advantage of, seeing that rental rates are increasing.
However, as already mentioned, the Fed’s numbers on rent are backward-looking. In real-time, they are behind by a few months. The actual numbers from reputable real estate platforms show an easing in rent growth.
Real estate investors who already own long-term rental properties may need to deal with a loss in rental income, given the decrease in rates in a lot of areas.
As a real estate investor, investing in a long-term rental property at present may not be as profitable as it was last quarter. Given the still high rental rates, you can still get a decent enough profit on an investment property. However, profitability will still largely depend on the property’s location.
Related: 20 Best Markets for Real Estate Investing in 2023
5 Top Long-Term Rental Markets Worth Looking Into in 2023
According to real estate website Mashvisor and its October 2022 location report, here are the top five long-term rental markets. The markets are performing really well at present and show much promise for growth in 2023. The locations are ranked from the highest cash on cash return to the lowest.
1. Vero Beach, FL
- Median Property Price: $727,992
- Average Price per Square Foot: $294
- Days on Market: 91
- Number of Long-Term Rental Listings: 628
- Monthly Long-Term Rental Income: $2,618
- Long-Term Rental Cash on Cash Return: 4.26%
- Long-Term Rental Cap Rate: 4.37%
- Price to Rent Ratio: 23
- Walk Score: 78
2. Hallandale Beach, FL
- Median Property Price: $728,539
- Average Price per Square Foot: $415
- Days on Market: 92
- Number of Long-Term Rental Listings: 642
- Monthly Long-Term Rental Income: $2,853
- Long-Term Rental Cash on Cash Return: 3.61%
- Long-Term Rental Cap Rate: 3.72%
- Price to Rent Ratio: 21
- Walk Score: 79
3. Stuart, FL
- Median Property Price: $719,961
- Average Price per Square Foot: $361
- Days on Market: 68
- Number of Long-Term Rental Listings: 376
- Monthly Long-Term Rental Income: $2,931
- Long-Term Rental Cash on Cash Return: 3.57%
- Long-Term Rental Cap Rate: 3.62%
- Price to Rent Ratio: 20
- Walk Score: 42
4. Fountain Hills, AZ
- Median Property Price: $885,044
- Average Price per Square Foot: $359
- Days on Market: 92
- Number of Long-Term Rental Listings: 122
- Monthly Long-Term Rental Income: $3,161
- Long-Term Rental Cash on Cash Return: 3.42%
- Long-Term Rental Cap Rate: 3.46%
- Price to Rent Ratio: 23
- Walk Score: 39
5. Dania Beach, FL
- Median Property Price: $609,500
- Average Price per Square Foot: $376
- Days on Market: 63
- Number of Long-Term Rental Listings: 238
- Monthly Long-Term Rental Income: $2,404
- Long-Term Rental Cash on Cash Return: 3.37%
- Long-Term Rental Cap Rate: 3.45%
- Price to Rent Ratio: 21
- Walk Score: 86
To look for the most profitable rental properties in any location of your choice, click here.
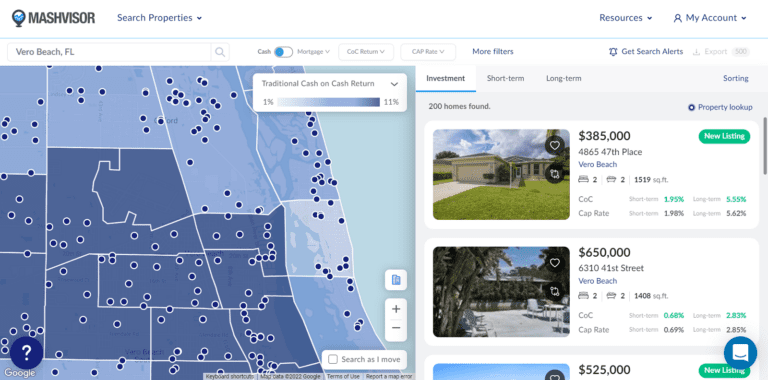
You can use Mashvisor to find high-performing locations and profitable rental properties based on your investment criteria and needs.
Will Short Term Rental Be More Profitable Than Traditional Rental in 2023?
Investing in rental properties is a good investment. It is one of the most popular long-term investment strategies taken by countless investors. However, you are left with a few options for rental property investment strategies:
- Long-Term Rental. Conventionally, long-term rentals pertain to investment properties that are rented out for a period of at least six months to a year. In most cases, landlords and tenants get into a contract good for a year. There is an option to renew the contract afterward, depending on the negotiations.
- Short-Term Rental. Properties rented out for a period of between a few days to a few weeks are considered short-term rental properties. Also called vacation rental properties, they are listed on various short-term rental platforms, such as Airbnb, Vrbo, and other similar sites.
- Mid-Term Rental. Amid the pandemic, a new trend in rental properties emerged and quickly gained popularity. They are mid-term rental properties that can be booked for a few months. As more people work remotely, they now enjoy the freedom and flexibility to travel. Mid-term rentals sprung about because of people who can afford a nomadic lifestyle.
Which Path Should You Choose?
As a rental property investor, you can choose among the three options above. Your choice depends on your personal preference and how you perform due diligence. Each market comes with its own strengths and weaknesses. You need to do your homework to see if a specific market indicates a strong renter’s market.
With rental rates remaining high, long-term rentals are still profitable. According to Mashvisor’s state-level data for October 2022, the median price for long-term rental income and cash on cash return are $1,851 (Texas) and 2.75% (South Carolina), respectively.
However, experts and analysts predict that short-term rentals will fully reestablish themselves as the clear winner in the rental market game. With most people returning to travel as economies reopened, the short-term rental industry’s been recovering quite well over the past few months. The recovery is expected to continue well into 2023.
According to US Travel, the monthly travel expenditure in the country for April 2022 (the time people returned to traveling) was higher by 3% compared to pre-pandemic April 2019 levels. It is a good sign for short-term rental investors as the rate of growth for the demand for vacation rentals is expected to go even further up in 2023.
Related: How to Find Profitable Rental Investment Properties for Sale
5 Top Short-Term Rental Markets Worth Looking Into in 2023
Short-term rentals are poised to recover and reestablish their position as the more profitable rental property type. We turned to Mashvisor’s report to see which markets are ideal for vacation rental properties with much potential for growth in 2023. The locations below are also ranked from highest to lowest cash on cash return.
1. Reading, OH
- Median Property Price: $225,180
- Average Price per Square Foot: $139
- Days on Market: 40
- Number of Short-Term Rental Listings: 171
- Monthly Short-Term Rental Income: $2,874
- Short-Term Rental Cash on Cash Return: 7.85%
- Short-Term Rental Cap Rate: 8.14%
- Short-Term Rental Daily Rate: $117
- Short-Term Rental Occupancy Rate: 53%
- Walk Score: 80
2. Schiller Park, IL
- Median Property Price: $280,389
- Average Price per Square Foot: $208
- Days on Market: 54
- Number of Short-Term Rental Listings: 110
- Monthly Short-Term Rental Income: $3,853
- Short-Term Rental Cash on Cash Return: 7.85%
- Short-Term Rental Cap Rate: 8.10%
- Short-Term Rental Daily Rate: $155%
- Short-Term Rental Occupancy Rate: 59%
- Walk Score: 71
3. West Saint Paul, MN
- Median Property Price: $268,376
- Average Price per Square Foot: $169
- Days on Market: 35
- Number of Short-Term Rental Listings: 320
- Monthly Short-Term Rental Income: $3,367
- Short-Term Rental Cash on Cash Return: 7.70%
- Short-Term Rental Cap Rate: 7.86%
- Short-Term Rental Daily Rate: $151
- Short-Term Rental Occupancy Rate: 62%
- Walk Score: 75
4. Richmond Heights, OH
- Median Property Price: $229,130
- Average Price per Square Foot: $131
- Days on Market: 108
- Number of Short-Term Rental Listings: 234
- Monthly Short-Term Rental Income: $2,958
- Short-Term Rental Cash on Cash Return: 7.45%
- Short-Term Rental Cap Rate: 7.63%
- Short-Term Rental Daily Rate: $136
- Airbnb Occupancy Rate: 51%
- Walk Score: 23
5. Bellwood, IL
- Median Property Price: $257,900
- Average Price per Square Foot: $198
- Days on Market: 54
- Number of Short-Term Rental Listings: 152
- Monthly Short-Term Rental Income: $3,677
- Short-Term Rental Cash on Cash Return: 7.45%
- Short-Term Rental Cap Rate: 7.69%
- Short-Term Rental Daily Rate: $161
- Short-Term Rental Occupancy Rate: 64%
- Walk Score: 82
To find the best short-term rental properties in the most profitable cities and neighborhoods, click here.
Wrapping It Up
To sum it up, credible real estate sources believe rent growth eased in the past couple of months. As an investor, you must pay attention to sources that give you real-time data to allow you to make the right and timely decisions.
Mashvisor can give you access to a huge real estate database that covers almost every area in the US housing market.
To access Mashvisor’s real estate investment tools, sign up for a 7-day free trial today, followed by 15% off for life.