
If you’re currently operating on a tighter budget and looking for low housing market prices, here’s how our tool can assist you in your search.
Table of Contents
- The Current State of the US Housing Market
- How To Find Housing With Low Market Prices?
- Using the Heatmap Tool
- 10 Cities With the Lowest Housing Market Prices
- Final Thoughts
We won’t sugarcoat things; looking for properties with low housing market prices in today’s climate can be somewhat challenging.
Real estate prices are constantly jumping, and many investors are working on a tight budget, making it harder to generate a profit.
But even if that weren’t the case, operating within an all-encompassing market such as the US real estate market would still require using investment tools to pin down the locations of interest.
And that’s something we’d like to discuss today.
The Current State of the US Housing Market
Is it even possible to locate low-priced investment properties, considering today’s real estate market climate?
To get our answer, we’ll need to look at the current state of the US real estate market. Are housing market prices dropping or rising? Let’s go over some predictions as well.
By the end of 2021, investors witnessed a massive price jump—especially from September to November. And throughout 2022, we continue to see a rise in home prices. Experts state that they may go up by 6.2% this year.
And to add to it, mortgage rates are on an upward trend, too. It means that fewer homebuyers will be able to qualify for loans and afford to purchase a new property.
However, the uptrend is not expected to slow down the market in the least. And according to experts, 6.9 million homes will be sold by the end of 2022.
And speaking of homes being sold, we are seeing a trend of more and more people moving back to the big cities in search of job opportunities—or just a change of scenery. Either way, it means that the demand for houses in the suburbs and rural areas may slowly start to drop.
How to Find Housing With Low Market Prices?
Now that we’ve gone over the housing market prices over time and got familiar with the real estate “situation” in general, it’s time to address the real issue here:
How do you locate housing options with low market prices?
Before you start looking at the heatmap real estate prices, you should first consider how your investment strategy will develop—and where you should look for your target properties.
First of all, it’s imperative that you remain well-informed about the current situation in the real estate market. After you’ve gathered the necessary information, clearly define your goal and, of course, your budget.
Although it seems less likely given the current market climate, it is still possible to pin down low-priced properties, make significant returns, and earn a profit.
The question is, where to look? Here are our suggestions for getting started:
1. MLS Listings
For most people—including real estate investors—MLS listings are the first thing that comes to mind when they think about looking up properties for sale.
That’s perfectly understandable.
But even though they’re certainly a reliable option and will give you tons of results, no matter where you are, MLS listings will not necessarily offer the cheapest options.
And we assume that’s actually your goal here.
The thing is, low-priced homes that appear on MLS listings do not last long. So, real estate investors who scroll through the listings on a daily basis need to act fast if they see an offer that fits into their budget.
“Blink, and you’ll miss it,” as they say.
Related: How to Access MLS Listings Without an Agent: Investor’s Guide
2. Foreclosures
When the original owner of the property is experiencing financial problems and is overdue on payments, the lenders can start a foreclosure process. They will “take away” the property and resell it. That’s what foreclosures stand for and how they work.
The foreclosed properties are typically put up for sale in a public auction and represent a tempting offer for investors looking for low-priced property to invest in. However, you should be careful.
Just because they are up for sale and the bidding price is within your budget, it does not mean that the quality is there and that the property is worth it. Make sure to inspect the property thoroughly before closing the deal.
3. Wholesalers
In brief, a wholesaler is a “businessman” who purchases the property or already got it under a binding contract before passing it on to you—the real estate investor.
They can help you find cheap housing options, but they’ll expect a “cut.” How much they’ll be expecting is up for debate, though—and it generally depends on the agreement between the two parties involved.
There are two sides to the wholesaling option:
Some think it’s way too much work, while others perceive it as a “clean business,” where they can purchase a property without worrying much about the details.
Using the Heatmap Tool
If you are eager to locate low-budget housing options, we highly recommend that you rely on Mashvisor’s real estate heatmap tool.
What exactly does the tool do for you as real estate investors?
Mashvisor’s Heatmap is an investment tool specifically designed for real estate investors looking to conduct a more in-depth analysis of the properties in their area.
In essence, the real estate heatmap aims at neighborhood analysis. The tool helps investors locate the most profitable properties that will generate the highest income.
How does the heatmap tool work?
In one word – easy. It uses property data combined with predictive analytics and then utilizes different colors to depict different ranges depending on the metrics that are of the essence to real estate investors.
The two primary colors you’ll encounter when looking at the map are green and red. As for the metrics within Mashvisor’s real estate heatmap tool, they are as follows:
- Listing Price
- Traditional Cash on Cash Return
- Airbnb Cash on Cash Return
- Traditional Rental income
- Airbnb Rental Income
- Airbnb Occupancy Rate
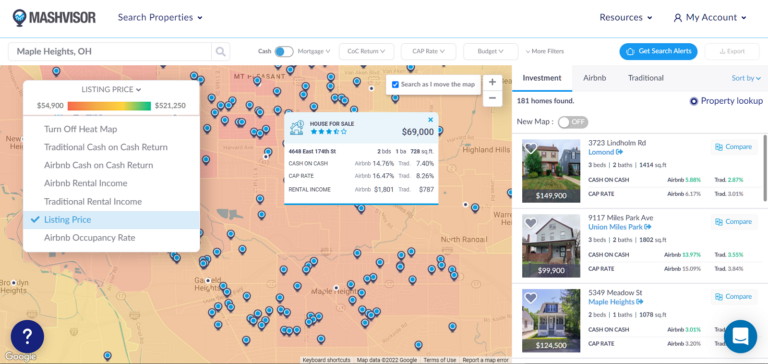
Mashvisor’s Heatmap tool allows real estate investors to perform a more in-depth neighborhood analysis and find the most profitable properties in their preferred location.
Lumber Prices Housing Market
In 2022, real estate investors should also pay attention to lumber prices.
While the cost of lumber isn’t the only thing to blame for the rise in property prices, the truth is that lumber prices do significantly impact real estate market prices. It was one of—but not the only—cause of the housing prices rising significantly between 2020 and 2021.
This year, however, we are seeing a drop in lumber prices.
If you’ve been keeping up with the situation, you’ve probably witnessed a 5% rise in fixed 30-year mortgages earlier this year. It is the highest they have been since 2009, making home buyers seriously reconsider their real estate investing strategies.
Combine the mortgage rates and rising housing costs, and it’s easy to see why so many people struggle with finding houses they can afford.
For a more precise visualization of the Median Sales Price of Houses Sold in the United States, check out this chart.
Related: Mortgage Rates: The Real Estate Investor’s Complete Guide
10 Cities With the Lowest Housing Market Prices
If you’re interested in looking up the lowest market prices for houses right now, here are the top ten cities that should be on your list according to Mashvisor’s latest data. The locations are ranked from the lowest to the highest in terms of the median property price.
1. La Salle, IL
- Median Property Price: $89,714
- Average Price per Square Foot: $84
- Days on Market: 35
- Monthly Traditional Rental Income: $784
- Traditional Cash on Cash Return: 5.77%
- Traditional Cap Rate: 6.44%
- Price to Rent Ratio: 10
- Monthly Airbnb Rental Income: $2,674
- Airbnb Cash on Cash Return: 9.49%
- Airbnb Cap Rate: 9.98%
- Airbnb Daily Rate: $170
- Airbnb Occupancy Rate: 61%
- Walk Score: 0
2. Boonville, NY
- Median Property Price: $104,967
- Average Price per Square Foot: $92
- Days on Market: 169
- Monthly Traditional Rental Income: $850
- Traditional Cash on Cash Return: 5.07%
- Traditional Cap Rate: 5.51%
- Price to Rent Ratio: 10
- Monthly Airbnb Rental Income: $1,275
- Airbnb Cash on Cash Return: 6.22%
- Airbnb Cap Rate: 6.82%
- Airbnb Daily Rate: $173
- Airbnb Occupancy Rate: 47%
- Walk Score: 0
3. Maple Heights, OH
- Median Property Price: $126,086
- Average Price per Square Foot: $103
- Days on Market: 64
- Monthly Traditional Rental Income: $1,061
- Traditional Cash on Cash Return: 5.86%
- Traditional Cap Rate: 5.29%
- Price to Rent Ratio: 10
- Monthly Airbnb Rental Income: $1,134
- Airbnb Cash on Cash Return: 6.01%
- Airbnb Cap Rate: 5.52%
- Airbnb Daily Rate: $90
- Airbnb Occupancy Rate: 64%
- Walk Score: 63
4. Mandan, ND
- Median Property Price: $191,383
- Average Price per Square Foot: $146
- Days on Market: 90
- Monthly Traditional Rental Income: $1,153
- Traditional Cash on Cash Return: 4.58%
- Traditional Cap Rate: 4.82%
- Price to Rent Ratio: 14
- Monthly Airbnb Rental Income: $1,746
- Airbnb Cash on Cash Return: 5.25%
- Airbnb Cap Rate: 5.52%
- Airbnb Daily Rate: $105
- Airbnb Occupancy Rate: 62%
- Walk Score: 66
5. Melvindale, MI
- Median Property Price: $200,057
- Average Price per Square Foot: $155
- Days on Market: 51
- Monthly Traditional Rental Income: $1,231
- Traditional Cash on Cash Return: 4.59%
- Traditional Cap Rate: 4.83%
- Price to Rent Ratio: 14
- Monthly Airbnb Rental Income: $2,529
- Airbnb Cash on Cash Return: 7.58%
- Airbnb Cap Rate: 7.94%
- Airbnb Daily Rate: $107
- Airbnb Occupancy Rate: 63%
- Walk Score: 62
6. Zion, IL
- Median Property Price: $201,404
- Average Price per Square Foot: $145
- Days on Market: 54
- Monthly Traditional Rental Income: $1,629
- Traditional Cash on Cash Return: 4.47%
- Traditional Cap Rate: 4.69%
- Price to Rent Ratio: 10
- Monthly Airbnb Rental Income: $3,134
- Airbnb Cash on Cash Return: 7.31%
- Airbnb Cap Rate: 7.62%
- Airbnb Daily Rate: $170
- Airbnb Occupancy Rate: 65%
- Walk Score: 61
7. Taylor, PA
- Median Property Price: $211,127
- Average Price per Square Foot: $98
- Days on Market: 40
- Monthly Traditional Rental Income: $1,113
- Traditional Cash on Cash Return: 3.30%
- Traditional Cap Rate: 3.50%
- Price to Rent Ratio: 16
- Monthly Airbnb Rental Income: $2,405
- Airbnb Cash on Cash Return: 5.98%
- Airbnb Cap Rate: 6.24%
- Airbnb Daily Rate: $124
- Airbnb Occupancy Rate: 74%
- Walk Score: 9
8. Madison Heights, VA
- Median Property Price: $214,840
- Average Price per Square Foot: $155
- Days on Market: 68
- Monthly Traditional Rental Income: $881
- Traditional Cash on Cash Return: 2.24%
- Traditional Cap Rate: 2.36%
- Price to Rent Ratio: 20
- Monthly Airbnb Rental Income: $2,213
- Airbnb Cash on Cash Return: 4.28%
- Airbnb Cap Rate: 4.43%
- Airbnb Daily Rate: $242
- Airbnb Occupancy Rate: 46%
- Walk Score: 29
9. Lindenwold, NJ
- Median Property Price: $220,308
- Average Price per Square Foot: $156
- Days on Market: 61
- Monthly Traditional Rental Income: $1,551
- Traditional Cash on Cash Return: 3.22%
- Traditional Cap Rate: 3.34%
- Price to Rent Ratio: 12
- Monthly Airbnb Rental Income: $2,400
- Airbnb Cash on Cash Return: 5.42%
- Airbnb Cap Rate: 5.66%
- Airbnb Daily Rate: $145
- Airbnb Occupancy Rate: 63%
- Walk Score: 42
10. Springfield, MA
- Median Property Price: $225,129
- Average Price per Square Foot: $177
- Days on Market: 141
- Monthly Traditional Rental Income: $1,354
- Traditional Cash on Cash Return: 3.63%
- Traditional Cap Rate: 3.78%
- Price to Rent Ratio: 14
- Monthly Airbnb Rental Income: $2,433
- Airbnb Cash on Cash Return: 7.36%
- Airbnb Cap Rate: 7.71%
- Airbnb Daily Rate: $267
- Airbnb Occupancy Rate: 62%
- Walk Score: 53
Related: Should You Buy Expensive Real Estate or Avoid It?
Final Thoughts
We’ve successfully covered the topic of housing market prices. As always, let’s summarize the key points we’ve gone through before we wrap things up.
To get a headstart, you’ll first need to look into the current situation and maybe go over the housing market prices chart. It will help you get a realistic view of the real estate market’s current climate and the supply-demand relationship.
With reliable assistance—like the real estate heatmap service provided by Mashvisor—you’ll be able to locate a profitable property that’s low-priced and fits your budget.
That said, you can also count on MLS listings, foreclosures, and wholesalers.
We’ve also outlined the top 10 cities that currently boast low median property prices. It’s up to you, the investor, to continue your research and decide whether one of these options works for you or not.
As investors, your primary goal is to make high returns on your investment property, right?
Well, in order to achieve that, you’ll need assistance from Mashvisor. Mashvisor’s real estate platform provides a range of tools that help investors find the right properties based on their goals and investment criteria.
By using our Investment Property Calculator, real estate investors can easily predict the profit that their target real estate could generate.
To start using Mashvisor’s real estate investment tools, sign up for a 7-day free trial now, followed by 15% off for life.