

Finding the best Airbnb analytics tool is essential when you want to maximize your profit from investing or owning a short-term Airbnb rental.
Table of Contents
- Is Owning an Airbnb Profitable?
- Why Do You Need an Airbnb Analytics Tool?
- Why Is Mashvisor the Best Tool to Use?
- How to Analyze an Airbnb Market Using Mashvisor
Whether you’re a beginner investor or an experienced one, using real estate analytics tools is the go-to method to analyze markets and properties for investment.
From finding the right properties for sale, assessing individual investment opportunities, and analyzing an entire market for its potential, online tools can help you do it all.
In this article, we will discuss the importance of using Airbnb analytics tools when you want to invest in an Airbnb rental. We will also talk about Mashvisor’s tools for Airbnb analytics and why they’re considered the best of their kind when analyzing Airbnb markets and properties.
Finally, we will look at the step-by-step process of using the best Airbnb analytics tool to find investment properties by 2023.
Is Owning an Airbnb Profitable?
Yes, owning an Airbnb property can be a very profitable investment. Whether you’re a beginner investor or a property owner looking to make an extra income, owning an Airbnb rental property should be on your mind.
Nowadays, most investors are aware of the advantages that short-term rentals offer. Such benefits allow Airbnb properties to potentially generate more profit than traditional rentals.
In order to understand the short-term rental’s benefits, let’s first take a quick look at the difference between an Airbnb property and a traditional rental.
Airbnb vs Traditional Rental Property
Before buying my first Airbnb property, we would first want to know what is an Airbnb rental and why is it different from a traditional rental.
Simply put, traditional rentals refer to homes or apartments rented out on a monthly or annual basis. They usually involve a landlord-tenant agreement with specific terms and rental rates, taking effect as long as the same tenant is renting it.
Airbnb rentals, on the other hand, can be an entire house or a room in a house that is rented out to short-term guests for stays that can last from one day up to a couple of weeks. It allows the owner of the Airbnb property to adjust the terms and the rental rate of renting the property between guests.
It also means that the best Airbnb rentals will always experience a much higher turnover rate than traditional rentals.
What Makes Airbnb Rentals Profitable?
Of course, when looking at the main differences between traditional and Airbnb rentals, it is easy to see why the latter is considered more profitable, especially in our current data-driven times.
Since the owner of the property can adjust the rental rates between guests, a smart owner who knows how to set the right rental rate can maximize their profits.
In the past, it was a skill that few investors possessed due to the unavailability of the tools and the data required to make such rapid and constant adjustments. However, in 2022, there are plenty of tools and online platforms that can help you every step of the way.
Airbnb, for a start, revolutionized short-term rentals and made them accessible to any beginner investor or homeowner. But the best Airbnb analytics platforms like Mashvisor give you the tools and the data to be updated on the market, its current rental rates, and what rates are the most profitable.
Although it means that you’ll need to put more effort and time into managing and running your Airbnb rental to maximize its profits, it also means you will be making more money.
Why Do You Need an Airbnb Analytics Tool?
Investing in an Airbnb rental is generally more complex than investing in a traditional rental, and it requires a deeper level of analysis that accounts for frequent dynamic changes.
The most important and sought-after characteristic of short-term rentals is that their rental rates are not fixed, and they can be changed on a daily or weekly basis. It means that maximizing the profit from an Airbnb rental is all about min-maxing your rental rates, which requires an understanding of the market and its seasonality of demand.
By understanding an Airbnb market, investors can limit renting out the property to certain seasons of the year when they can ask for the most amount of rent, therefore maximizing their profit.
But how do the best Airbnb analytics tools help you and provide you with the insights that you need to achieve that outcome?
What Do the Best Airbnb Analytics Tools Provide?
When looking for the best Airbnb analytics tools, there are a number of features that investors expect to find.
While the features that investors need to use depend on their strategy and what they’re trying to get from the tool, it is always recommended to look for the best Airbnb tools that offer a wide range of features.
Airbnb Market Analytics
The first feature that investors expect to find in the best Airbnb analytics tool is the ability to conduct a market analysis or obtain market analytics and insights.
An Airbnb analytics tool is expected to allow investors to get an idea about a market in terms of the average rental rates, median property prices, and other useful data. The best tools will allow for flexibility and accuracy by letting you to set parameters and analyze real estate markets down to the level of neighborhoods while also providing city-wide analytics.
Such a feature should let you understand how much money you would need as an investor to buy an Airbnb rental in that market and how much rental income should you expect to generate.
Of course, a very useful added feature here is the ability to see the seasonality of a market.
By providing historical data about rental rates and how they’ve changed in the past, investors should be able to use the best Airbnb analytics tool to learn what seasons have the highest demand.
Airbnb Rental Income Analytics
Another crucial feature among the best Airbnb analytics tools is the ability to analyze individual short-term rental properties and gain useful insights to help maximize the return on investment.
Typically, it is the main feature that investors and Airbnb owners look for in the best analytics tools as it is a useful tool for managing your short-term rental.
While the said feature can be used for Airbnb financial property management, the best tools will offer insights and analytics about listed investment properties to help you find the best one.
Airbnb Investment Property Finder
The ability to find investment properties for sale by using data and analytics has been one of the biggest challenges that beginner investors face.
However, in today’s online real estate investment market, beginner investors have several tools to choose from that allow them to search for and find the best property for them.
The best Airbnb analytics tool should offer features that help investors find properties that match their investment strategy and their finances. With the help of real estate analytics, the best tools will often incorporate all the above features together to help investors on every step of their investment journey.
So, instead of only allowing you to look at analytics in a specific market or only for properties that you own, the best Airbnb analytics tool should provide you with all of the analytics to use while searching for a property to buy.
Related: How Is Mashvisor’s Property Finder Helping Real Estate Investors?
Why Is Mashvisor the Best Airbnb Analytics Tool to Use?
If you’re looking for the best Airbnb analytics tool, then Mashvisor is the answer you’re looking for. Mashvisor is a real estate investment platform that was designed to help investors find the right traditional or Airbnb rentals to buy and start generating a profit.
By utilizing real estate data from several trusted sources and machine learning algorithms, Mashvisor analyzes markets and properties and provides data and insights to the user. The platform includes multiple tools that offer the best and most sought-after features by beginner and experienced investors.
The tools help you analyze markets and give you market-wide insights, allowing you to search for properties that match your goal and evaluate them for their future returns.
With the use of predictive analytics, Mashvisor even provides useful metrics to best analyze the return on investment of Airbnb rentals. The metrics include cap rate and cash on cash return.
Before talking about the step-by-step process of using Mashvisor’s Airbnb analytics tool for finding and analyzing the best rental property for you, let’s talk about where our data comes from and how it’s processed.
How Accurate Is Mashvisor’s Data?
Mashvisor’s data is very accurate and always up to date. When you’re looking for the best and most accurate Airbnb analytics, Mashvisor ensures that the insights provided are based on data that we get from trusted sources.
For general information and details about properties listed for sale, the real estate website gathers its data from several MLS sources that cover different markets.
When it comes to Airbnb analytics, however, Mashvisor’s data comes directly from Airbnb’s platform, which makes it as accurate as it can be.
By combining data from the MLS and Airbnb, our AI can produce insights related to:
- The monthly and annual rental income of properties
- Median property prices in different markets
- Separate analytics for short-term and long-term rentals
- Projections about the potential return on investment
- Rental comps for traditional and Airbnb rentals
How to Analyze an Airbnb Market Using Mashvisor
Using the best Airbnb analytics tool to analyze an Airbnb market is quite simple when the tool you’re using is Mashvisor. The easy-to-use tools that the real estate website offers let you carry out your Airbnb market analysis quickly and easily.
Since all of our tools share the same data and insights, you will find filters and features that integrate analytics across several tools, making the process more seamless.
So, let’s look at the different steps you will be taking when using Mashvisor’s best Airbnb analytics tool to analyze an Airbnb market.
Using the Map Tool to Search Markets
The first feature that you will find when using Mashvisor is the map search tool that is designed with several filters and options to help you conduct your search. Using the tool is quite simple, and it doesn’t involve a sharp learning curve.
Additionally, it includes tooltips and guides to help you better understand the filters and the different options that you can use.
Firstly, you can use the search bar to enter the name of a state, city, neighborhood, street, or a single property address. Depending on your search query, the map view will change to show you the area that you want to look at.
You can zoom in and out on the map, and as you do so the information that you see on the map will become different and more relevant to the area you’re looking at.
It allows you to get a good impression of different markets and neighborhoods by looking at their general stats on the map based on the following metrics:
- Airbnb Cash on Cash Return
- Airbnb Rental Income
- Listing Price
- Airbnb Occupancy Rate
By zooming in and out freely, you should be able to scan as many markets as you want until you’ve found the best one that suits your investment goals and your finances.
Related: Mashvisor Property Search: Is It Still Helping Investors in 2022?
Using Rental Comps to Analyze Airbnb Markets
Real estate investors will find a rental comps tool useful for analyzing small Airbnb markets. Rental comps refer to the process of comparing similar properties to find what we’re looking for.
By using a spreadsheet or an Excel table, you enter the data and information about a number of properties that you’re interested in. The properties must be comparable; meaning that they must be similar in type, size, number of rooms, and are all in the same location.
Afterward, you use the spreadsheet to sort properties based on different values, such as their price per square foot, occupancy rate, rental rate, or cash on cash return.
The above process gives you an accurate idea about the rental income that properties of a specific type in a specific market will generate. It also lets you identify properties that are performing particularly well or that are generating below-average rental income.
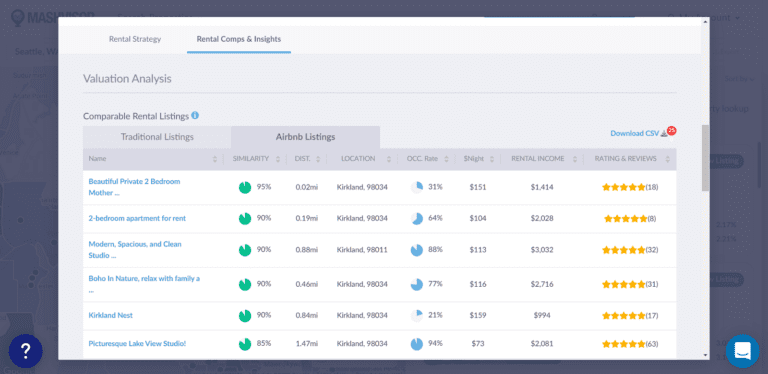
Mashvisor’s Rental Comps tool shows an Airbnb property’s rental income, daily rate, and occupancy rate. It allows you to compare the numbers to that of other properties in the same neighborhood.
Where Can I Find Rental Comps on Mashvisor?
When you click on any property on Mashvisor, whether from the map tool or any other part of the platform, you will open that property’s analytics page. The page will include all the necessary analytics that investors want to use when analyzing Airbnb rentals. They include their rental income and a breakdown of their return on investment.
At the bottom of the page, you will find the rental comps table. You can toggle the table between traditional and Airbnb rental comps, depending on your desired rental strategy. When comparing Airbnb rentals, the tool will show you the similarity rating of each property you’re comparing with.
Additionally, it will show you important metrics such as the rental income, daily rate, and occupancy rate of each property. It can help you learn more about each neighborhood or street within a market. You’ll identify the best-performing Airbnb property within that market that you can invest in.
Finally, the rental comps tool will help investors know what is a good Airbnb occupancy rate in the market that they’re analyzing.
Related: Rental Comps: What Are They and Where Can I Find Them?
Mashvisor’s Rental Comps tool shows an Airbnb property’s rental income, daily rate, and occupancy rate. It allows you to compare the numbers to that of other properties in the same neighborhood.
Bottom Line: Best Airbnb Analytics Tool for 2023
Using the best Airbnb analytics tool allows you to find the best short-term rental markets. It will also help you search for the best-performing properties within their preferred locations and neighborhoods.
You can choose among several online options regarding the best Airbnb analytics tools for 2023, such as AirDNA and Mashvisor. We believe that Mashvisor is the best Airbnb analytics tool that you can use. You can access the wide variety of tools and features that provided by the platform. You can also benefit from the accuracy and depth of the data provided.
Using Mashvisor to find an Airbnb market or the best Airbnb property based on analytics is easy and quick. By following a few simple steps, you can analyze a particular market and find an Airbnb rental for sale in just a few minutes.
To get access to our real estate investment tools, click here to sign up for a 7-day free trial of Mashvisor today, followed by 15% off for life.