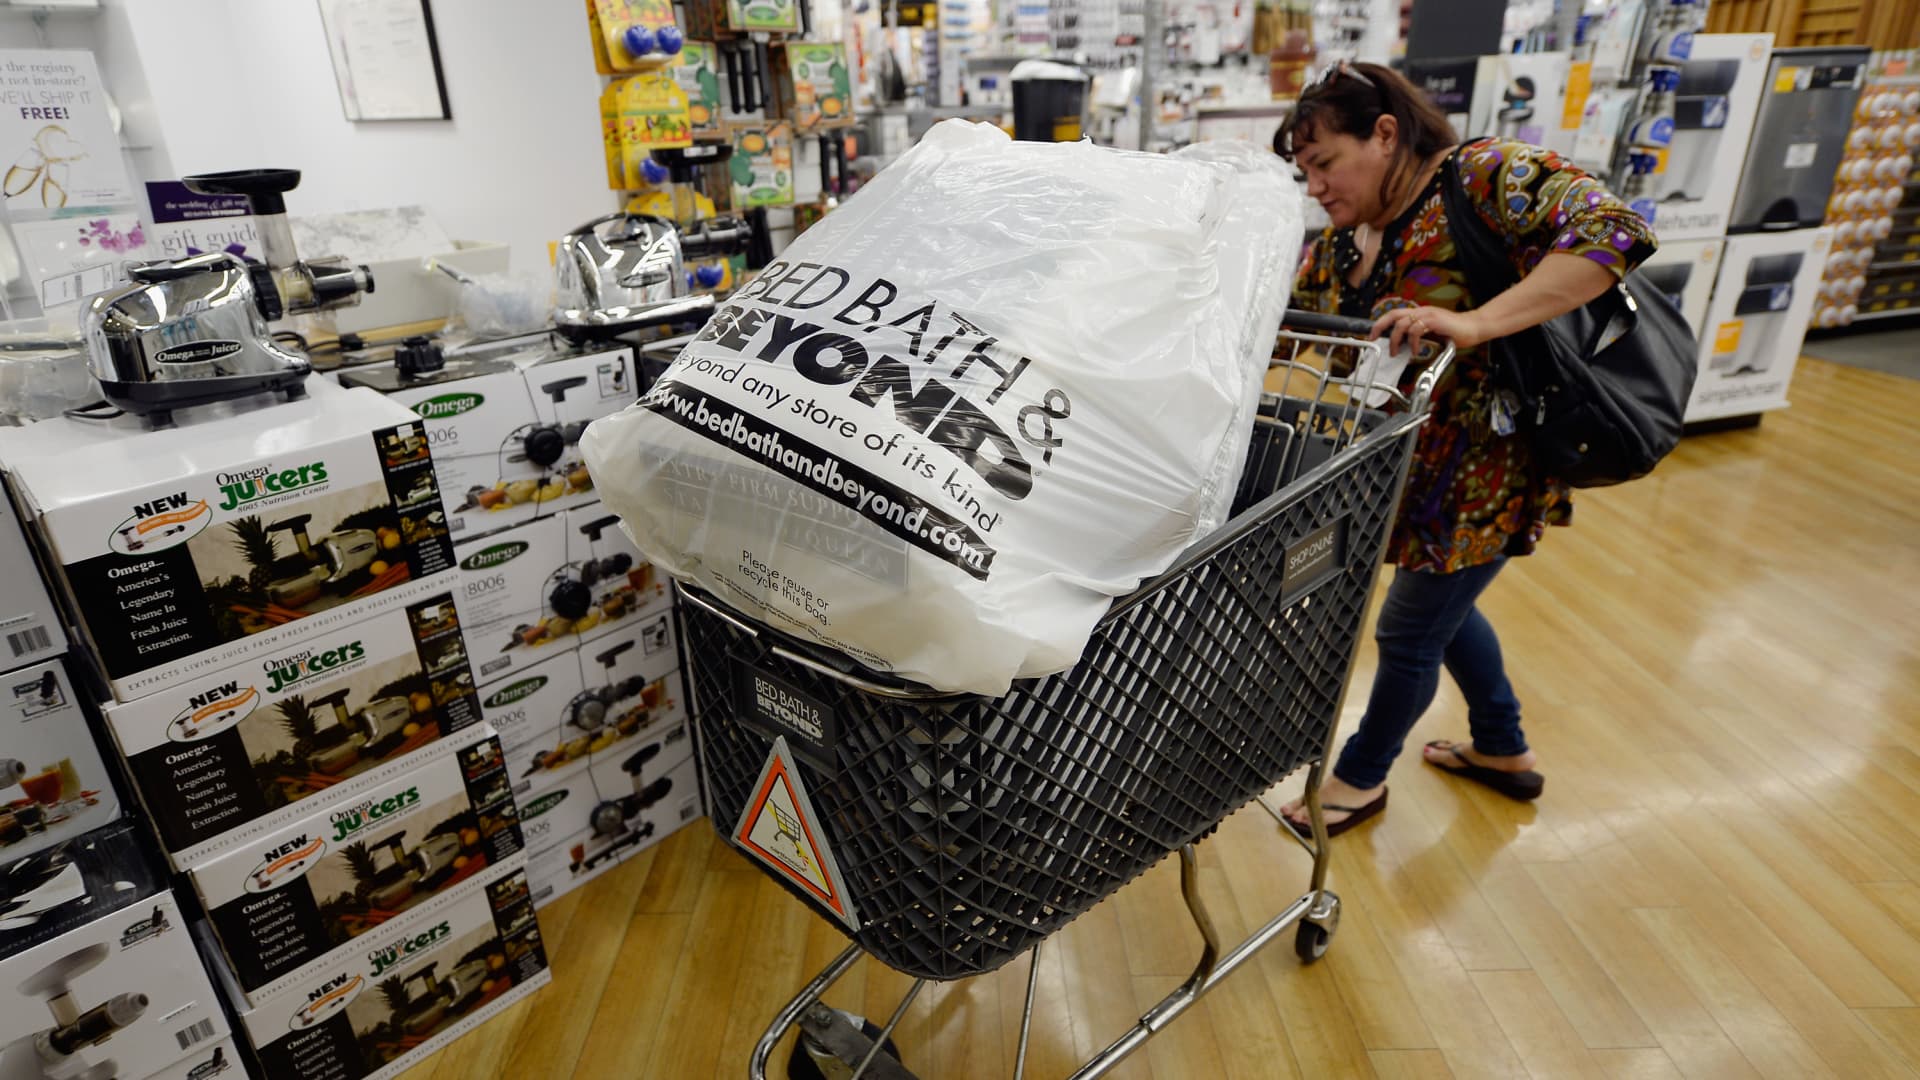
Feverish trading in speculative stocks can be a warning sign that the broader market is near a top. Bed Bath & Beyond has been one of those plays, surging 25% Wednesday afternoon. That follows five jumps of at least 20% this month. The stock ended July at $5.03 and was near $26 Wednesday. Investors have cheered the rally on social media outlets, but strategists who study charts caution that this type of trading can signal a market peak. The stock got a boost this week when GameStop Chairman Ryan Cohen’s venture capital firm RC Ventures made another bet on Bed Bath & Beyond, including positions in out-of-the-money calls. “We’ve seen it before. The biggest being January 2021. We saw a little of it in March this year,” said Jonathan Krinsky, chief market technician at BTIG. In January 2021, GameStop was surging and investors were jumping into meme names like AMC Entertainment and BlackBerry. This year, Bed Bath & Beyond shares popped on March 28 and 29, the peak of that rally, Krinsky noted. GameStop had also surged in the six days leading up to March 29, he added. Bed Bath & Beyond was rallying Wednesday, and other meme names like AMC and GameStop were lower on the day. Growth stocks were also lower, including the Ark Innovation ETF , a poster child for high growth. The small cap Russell 2000, w hich has been outperforming, was also lower Wednesday. “Typically when you get to the tail end of a rally, they go after the highly speculative meme type names,” said Scott Redler, chief strategic officer at T3Live. “That usually gives us clues a peak is coming and that could have been yesterday.” Missing a key threshold On Tuesday, the S & P 500 came up against its 200-day moving average, but the broad market measure did not break above it. The 200-day is the average of the last 200 closes, and it is often viewed as the line between a bullish market and a bearish one. The 200-day was at 4,324 Wednesday. The S & P 500 was off about 0.8% in afternoon trading, at about 4,272. “For the last three days, weakness has been absorbed. If buyers don’t step in, we’re ready for more of a downward retracement,” said Redler. He added that S & P 500 could now have seen its highs of the summer, after yesterday’s failure to hold the 200-day. The intraday high was 4,325. “When you see highly speculative meme, junk type of stocks moving like that, that means the real money isn’t finding any opportunities in stocks like Apple, Tesla. They’ve run their course,” said Redler. Apple and Tesla rose modestly Wednesday. Redler said since the June lows, the 8-day moving average has proven to be support for the S & P 500. “That’s the first spot traders will watch to see if it keeps buyers coming in. That’s 4,230. If that doesn’t hold, traders would be more cautious and we could pull back to the 50-day, which is what institutions will play,” he said. That is currently 3,962. “The meme frenzy is usually indicative of speculation and froth and the end of an active sequence. Up to the 200-day is a likely spot for the market to rest for the rest of the summer,” he said. Redler said it appears clear the broad market index hit its low in June, but its course now is murky. “It’s hard to place big bets on what the next move will be. But I think a high probability is more of a retracement… It could be 5% to 7% toward the 4,000 area,” he said. He added the first area of support should be 4,170 to 4,220. Krinsky is eyeing the 4,177 to 4,200 level, as support. “That was the breakout level above the June low. You can pull back to that and still be okay for this established uptrend,” he said.
